Ward County, North Dakota
| Ward County, North Dakota | |
|---|---|
 | |
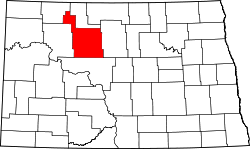 Location in the U.S. state of North Dakota | |
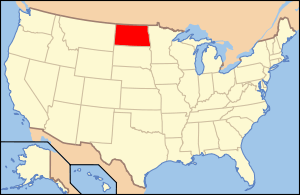 North Dakota's location in the U.S. | |
| Founded | November 23, 1885 |
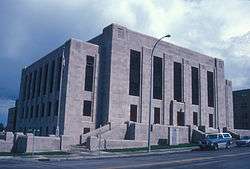
| Seat | Minot |
| Largest city | Minot |
| Area | |
| • Total | 2,056 sq mi (5,325 km2) |
| • Land | 2,013 sq mi (5,214 km2) |
| • Water | 43 sq mi (111 km2), 2.1% |
| Population (est.) | |
| • (2016) | 70,210 |
| • Density | 31/sq mi (12/km2) |
| Congressional district | At-large |
| Time zone | Central: UTC−6/−5 |
| Website |
www |
Ward County is a county located in the U.S. state of North Dakota. As of the 2010 census, the population was 61,675,[1] making it the fourth-most populous county in North Dakota. Its county seat is Minot.[2] The county was formed in 1885.[3][4]
Ward County is part of the Minot, ND Micropolitan Statistical Area.
History
Ward County was created by the 1885 Dakota Territory legislature and named for Mark Ward, chairman of the House of Representatives Committee on Counties during the session. The county government was first organized on November 23, 1885 with Burlington as the county seat. This was changed to Minot in 1888.[3]
Until 1908, Ward County included what is now Burke, Mountrail, and Renville counties; this landmass often being referred to as 'Imperial Ward' County and which was the largest county in the state at the time. In 1908, voters took up measures to partition the county. The results for that portion forming Mountrail County were accepted but a dispute over the results for the portions that would become Burke and Renville counties was taken to court and which resulted in favorable rulings in 1910. In addition, when the proposed county lines for Burke and Renville counties were drawn, neither group wanted to include Kenmare and risk that city becoming the county seat, so Kenmare was left in Ward County at the end of a narrow strip of land, commonly referred to as the 'gooseneck'.[5]
Geography
According to the U.S. Census Bureau, the county has a total area of 2,056 square miles (5,330 km2), of which 2,013 square miles (5,210 km2) is land and 43 square miles (110 km2) (2.1%) is water.[6] It is the fifth-largest county in North Dakota by land area.
Much of the county is flat to rolling plains. The southern reaches of the county are dotted with numerous small lakes, water neither sloping towards the Souris River basin nor Lake Sakakawea.
Major highways


Adjacent counties
- Renville County (north)
- McHenry County (east)
- McLean County (south)
- Mountrail County (west)
- Burke County (northwest)
National protected areas
Demographics
| Historical population | |||
|---|---|---|---|
| Census | Pop. | %± | |
| 1890 | 1,681 | — | |
| 1900 | 7,961 | 373.6% | |
| 1910 | 25,221 | 216.8% | |
| 1920 | 28,811 | 14.2% | |
| 1930 | 33,597 | 16.6% | |
| 1940 | 31,981 | −4.8% | |
| 1950 | 34,782 | 8.8% | |
| 1960 | 47,072 | 35.3% | |
| 1970 | 58,560 | 24.4% | |
| 1980 | 58,392 | −0.3% | |
| 1990 | 57,921 | −0.8% | |
| 2000 | 58,975 | 1.8% | |
| 2010 | 61,675 | 4.6% | |
| Est. 2016 | 70,210 | [7] | 13.8% |
| U.S. Decennial Census[8] 1790-1960[9] 1900-1990[10] 1990-2000[11] 2010-2016[1] | |||
2000 census
As of the census of 2000, there were 58,795 people, 23,041 households, and 15,368 families residing in the county. The population density was 29 people per square mile (11/km²). There were 25,097 housing units at an average density of 12 per square mile (5/km²). The county is predominately White (92.40%), with African Americans and Native Americans making up 2.22% and 2.07% respectively. Asians and Pacific Islanders made up less than 1% of the population. Other races and those that identified as being two or more races made up 2.43%. 1.91% of the population were Hispanic or Latino of any race. 34.7% were of German ancestry and 27.9% Norwegian ancestry.
There were 23,041 households out of which 34.30% had children under the age of 18 living with them, 55.20% were married couples living together, 8.40% had a female householder with no husband present, and 33.30% were non-families. 27.20% of all households were made up of individuals and 9.80% had someone living alone who was 65 years of age or older. The average household size was 2.46 and the average family size was 3.01.
In the county, the population was spread out with 26.20% under the age of 18, 13.00% from 18 to 24, 29.10% from 25 to 44, 19.20% from 45 to 64, and 12.50% who were 65 years of age or older. The median age was 32 years. For every 100 females there were 99.20 males. For every 100 females age 18 and over, there were 96.50 males.
The median income for a household in the county was $33,670, and the median income for a family was $41,342. Males had a median income of $27,980 versus $19,830 for females. The per capita income for the county was $16,926. About 7.90% of families and 10.80% of the population were below the poverty line, including 12.50% of those under age 18 and 8.40% of those age 65 or over.
2010 census
As of the 2010 United States Census, there were 61,675 people, 25,029 households, and 15,597 families residing in the county.[12] The population density was 30.6 inhabitants per square mile (11.8/km2). There were 26,744 housing units at an average density of 13.3 per square mile (5.1/km2).[13] The racial makeup of the county was 90.3% white, 2.6% American Indian, 2.5% black or African American, 0.9% Asian, 0.1% Pacific islander, 0.7% from other races, and 2.7% from two or more races. Those of Hispanic or Latino origin made up 3.0% of the population.[12] In terms of ancestry, 44.4% were German, 30.8% were Norwegian, 11.6% were Irish, 5.7% were English, and 2.3% were American.[14]
Of the 25,029 households, 30.6% had children under the age of 18 living with them, 49.9% were married couples living together, 8.4% had a female householder with no husband present, 37.7% were non-families, and 30.0% of all households were made up of individuals. The average household size was 2.36 and the average family size was 2.95. The median age was 32.7 years.[12]
The median income for a household in the county was $48,793 and the median income for a family was $60,361. Males had a median income of $37,569 versus $28,415 for females. The per capita income for the county was $25,326. About 6.7% of families and 9.4% of the population were below the poverty line, including 13.0% of those under age 18 and 10.3% of those age 65 or over.[15]
Communities
Cities
Townships
- Afton
- Anna
- Baden
- Berthold
- Brillian
- Burlington
- Burt
- Cameron
- Carbondale
- Carpio
- Denmark
- Des Lacs
- Elmdale
- Eureka
- Evergreen
- Foxholm
- Freedom
- Gasman
- Greely
- Greenbush
- Harrison
- Hiddenwood
- Hilton
- Iota Flat
- Kenmare
- Kirkelie
- Linton
- Lund
- Mandan
- Margaret
- Maryland
- Mayland
- McKinley
- Nedrose
- New Prairie
- Newman
- Orlien
- Passport
- Ree
- Rice Lake
- Rolling Green
- Rushville
- Ryder
- St. Marys
- Sauk Prairie
- Sawyer
- Shealy
- Spencer
- Spring Lake
- Sundre
- Surrey
- Tatman
- Tolgen
- Torning
- Vang
- Waterford
- Willis
Census-designated places
Unincorporated communities
- Aurelia - "ghost town" south of Donnybrook
- Drady
- Gassman - founded as the Gassman Creek Coulee trestle was being built, now referred to as "Trestle Valley"
- Hartland - "ghost town" north of Berthold
- Hesnault
- Lonetree - small 100 person community northwest of Des Lacs and southeast of Berthold
- Rice Lake - small community around Rice Lake south of Minot
- Rice Lake Park
- South Prairie - small community with modern school, south of Minot
- Wolseth - diminishing community, south of the Renville County border, and Granville
Historical areas:
- Harrison - early sister community of Minot, annexed into Minot
- Ralston - railroad siding
- Roach - railroad siding
- Waldorf - annexed into Minot boundaries in its early years
Politics
| Year | Republican | Democratic | Third parties |
|---|---|---|---|
| 2016 | 68.0% 18,636 | 21.2% 5,806 | 10.8% 2,970 |
| 2012 | 63.7% 16,230 | 33.2% 8,441 | 3.1% 792 |
| 2008 | 58.5% 15,061 | 39.4% 10,144 | 2.2% 563 |
| 2004 | 66.4% 17,008 | 32.2% 8,236 | 1.4% 368 |
| 2000 | 62.3% 13,997 | 33.5% 7,533 | 4.2% 952 |
| 1996 | 48.0% 10,546 | 39.4% 8,660 | 12.6% 2,758 |
| 1992 | 46.6% 12,056 | 30.4% 7,856 | 23.0% 5,940 |
| 1988 | 56.7% 13,179 | 42.7% 9,906 | 0.6% 143 |
| 1984 | 68.1% 16,077 | 31.1% 7,336 | 0.9% 210 |
| 1980 | 67.6% 14,997 | 25.0% 5,554 | 7.4% 1,638 |
| 1976 | 56.1% 12,751 | 41.7% 9,484 | 2.1% 486 |
| 1972 | 66.6% 13,900 | 32.1% 6,706 | 1.3% 262 |
| 1968 | 53.1% 9,079 | 41.6% 7,105 | 5.3% 911 |
| 1964 | 38.3% 6,798 | 61.3% 10,871 | 0.4% 66 |
| 1960 | 54.8% 9,680 | 45.1% 7,954 | 0.1% 19 |
| 1956 | 61.0% 9,042 | 38.9% 5,762 | 0.2% 28 |
| 1952 | 66.6% 10,130 | 32.7% 4,966 | 0.8% 115 |
| 1948 | 48.6% 5,514 | 45.8% 5,189 | 5.6% 634 |
| 1944 | 48.3% 5,514 | 51.0% 5,822 | 0.7% 81 |
| 1940 | 45.6% 6,519 | 53.7% 7,669 | 0.7% 105 |
| 1936 | 22.4% 3,142 | 63.1% 8,872 | 14.5% 2,041 |
| 1932 | 33.2% 4,195 | 64.4% 8,129 | 2.4% 302 |
| 1928 | 59.7% 6,561 | 39.7% 4,362 | 0.6% 63 |
| 1924 | 48.0% 4,166 | 8.3% 721 | 43.7% 3,794 |
| 1920 | 67.4% 6,166 | 25.1% 2,291 | 7.5% 690 |
| 1916 | 35.4% 1,743 | 56.7% 2,791 | 7.8% 385 |
| 1912 | 19.6% 686 | 30.6% 1,071 | 49.8% 1,745[17] |
| 1908 | 57.4% 5,286 | 34.3% 3,163 | 8.3% 761 |
| 1904 | 78.2% 4,349 | 16.4% 914 | 5.4% 302 |
| 1900 | 68.1% 880 | 28.2% 364 | 3.8% 49 |
See also
References
- 1 2 "State & County QuickFacts". United States Census Bureau. Retrieved November 1, 2013.
- ↑ "Find a County". National Association of Counties. Retrieved 2011-06-07.
- 1 2 "County History". Official Portal for North Dakota State Government. Retrieved 4 May 2011.
- ↑ "Dakota Territory, South Dakota, and North Dakota: Individual County Chronologies". Dakota Territory Atlas of Historical County Boundaries. The Newberry Library. 2006. Retrieved February 4, 2015.
- ↑ Wick, Douglas A. "Kenmare (Ward County)". North Dakota Place Names. Retrieved 7 May 2011.
- ↑ "2010 Census Gazetteer Files". United States Census Bureau. August 22, 2012. Archived from the original on January 29, 2015. Retrieved February 1, 2015.
- ↑ "Population and Housing Unit Estimates". Retrieved June 9, 2017.
- ↑ "U.S. Decennial Census". United States Census Bureau. Retrieved February 1, 2015.
- ↑ "Historical Census Browser". University of Virginia Library. Retrieved February 1, 2015.
- ↑ Forstall, Richard L., ed. (April 20, 1995). "Population of Counties by Decennial Census: 1900 to 1990". United States Census Bureau. Retrieved February 1, 2015.
- ↑ "Census 2000 PHC-T-4. Ranking Tables for Counties: 1990 and 2000" (PDF). United States Census Bureau. April 2, 2001. Retrieved February 1, 2015.
- 1 2 3 "DP-1 Profile of General Population and Housing Characteristics: 2010 Demographic Profile Data". United States Census Bureau. Retrieved 2016-04-03.
- ↑ "Population, Housing Units, Area, and Density: 2010 - County". United States Census Bureau. Retrieved 2016-04-03.
- ↑ "DP02 SELECTED SOCIAL CHARACTERISTICS IN THE UNITED STATES – 2006-2010 American Community Survey 5-Year Estimates". United States Census Bureau. Retrieved 2016-04-03.
- ↑ "DP03 SELECTED ECONOMIC CHARACTERISTICS – 2006-2010 American Community Survey 5-Year Estimates". United States Census Bureau. Retrieved 2016-04-03.
- ↑ Leip, David. "Dave Leip's Atlas of U.S. Presidential Elections". uselectionatlas.org. Retrieved 2018-04-13.
- ↑ The leading "other" candidate, Progressive Theodore Roosevelt, received 1,065 votes, while Socialist Eugene Debs received 613 votes, Prohibition candidate Eugene Chafin received 67 votes.
External links
Places adjacent to Ward County, North Dakota | ||||||||||
|---|---|---|---|---|---|---|---|---|---|---|
| ||||||||||
Municipalities and communities of Ward County, North Dakota, United States | ||
|---|---|---|
| Cities | | |
| Townships | ||
| CDPs | ||
| Unincorporated communities | ||