Stark County, North Dakota
| Stark County, North Dakota | |
|---|---|
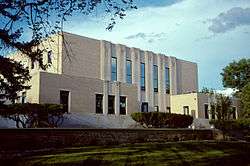 Stark County Courthouse in Dickinson | |
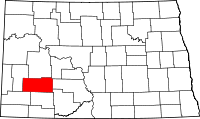 Location in the U.S. state of North Dakota | |
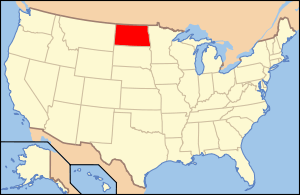 North Dakota's location in the U.S. | |
| Founded | May 25, 1883 |
| Seat | Dickinson |
| Largest city | Dickinson |
| Area | |
| • Total | 1,340 sq mi (3,471 km2) |
| • Land | 1,335 sq mi (3,458 km2) |
| • Water | 5.5 sq mi (14 km2), 0.4% |
| Population (est.) | |
| • (2016) | 31,199 |
| • Density | 18/sq mi (7/km2) |
| Congressional district | At-large |
| Time zone | Mountain: UTC−7/−6 |
| Website |
www |
Stark County is a county located in the U.S. state of North Dakota. As of the 2010 census, the population was 24,199.[1] Its county seat is Dickinson.[2] The county was formed in 1879 and organized in 1883.[3][4]
Stark County is part of the Dickinson, ND Micropolitan Statistical Area.
History
Stark County was created February 10, 1879, as a county within Dakota Territory from parts of Howard County and Williams County.[3] The county organized on May 25, 1883, and became a county in the state of North Dakota on November 2, 1889.[5]
1889-1901
In 1891, the North Dakota Legislature enacted legislation annexing Dunn County, Hettinger County, and parts of Billings, Bowman, McKenzie, Wallace, and Williams Counties into Stark. However, the act was vetoed by Governor Eli C. D. Shortridge.[5][6]
Additional annexation legislation was enacted in 1895, affecting the boundaries of Stark, Billings, and Mercer Counties, subject to approval by the counties' voters.[7] The annexation went into effect November 3, 1896,[5] but Wilson L. Richards, a local cattle rancher, sued to overturn the annexation because he and other landowners in the area were now subject to taxation by Stark County. The case went to the North Dakota Supreme Court, which ruled the law unconstitutional on May 18, 1899.[6][8][9] The annexation remained in effect, however, due to a replacement law approved by the legislature March 9, 1899, in anticipation of the court's decision.[5][10]
1901-present
This second annexation law was overturned by the North Dakota Supreme Court in 1901 because the annexation was not referred to the voters of the affected counties as required by the North Dakota Constitution.[11][12] This lawsuit involved a landowner, Henry Schaffner, whose property in Williams County was added to neighboring Mercer County by the 1899 law. Schaffner objected when the Mercer County sheriff seized and attempted to sell Schaffner's property to collect taxes the county claimed Schaffner owned. The court ruled that the seizure was illegal, since the 1895 ruling meant Schaffner's property was outside of Mercer County's jurisdiction.[11][12]
The Legislature passed a third annexation law in 1903, this time submitting it to the voters Stark County and the unorganized counties of Dunn and Hettinger for approval.[13] The annexation was approved by 502 votes in Stark County and 65 votes in Hettinger County, but it failed by 1 vote in Dunn County.[14] Stark County claimed the annexation vote valid, since the legislation required a majority of the aggregate votes cast. However, the North Dakota Constitution required a majority vote in each affected county subject to annexation, so the state of North Dakota sued Stark County on the grounds that the enabling legislation was unconstitutional and that the "no" vote in Dunn County meant the annexation failed. The North Dakota Supreme Court ruled the 1903 law unconstitutional in 1905.[14] Stark County received a minor boundary change in 1908 when Dunn County was formally organized.[3]
Geography
According to the U.S. Census Bureau, the county has a total area of 1,340 square miles (3,500 km2), of which 1,335 square miles (3,460 km2) is land and 5.5 square miles (14 km2) (0.4%) is water.[15]
Major highways
Adjacent counties
- Dunn County (north/CST Border in the north part of the county)
- Mercer County (northeast/CST Border)
- Morton County (east/CST Border)
- Grant County (southeast/CST Border)
- Hettinger County (south)
- Slope County (southwest)
- Billings County (west)
Demographics
| Historical population | |||
|---|---|---|---|
| Census | Pop. | %± | |
| 1890 | 2,304 | — | |
| 1900 | 7,621 | 230.8% | |
| 1910 | 12,504 | 64.1% | |
| 1920 | 13,542 | 8.3% | |
| 1930 | 15,340 | 13.3% | |
| 1940 | 15,414 | 0.5% | |
| 1950 | 16,137 | 4.7% | |
| 1960 | 18,451 | 14.3% | |
| 1970 | 19,613 | 6.3% | |
| 1980 | 23,697 | 20.8% | |
| 1990 | 22,832 | −3.7% | |
| 2000 | 22,636 | −0.9% | |
| 2010 | 24,199 | 6.9% | |
| Est. 2016 | 31,199 | [16] | 28.9% |
| U.S. Decennial Census[17] 1790-1960[18] 1900-1990[19] 1990-2000[20] 2010-2016[1] | |||
2000 census
As of the census of 2000, there were 22,636 people, 8,932 households, and 5,877 families residing in the county. The population density was 17 people per square mile (7/km²). There were 9,722 housing units at an average density of 7 per square mile (3/km²). The racial makeup of the county was 97.52% White, 0.23% Black or African American, 0.94% Native American, 0.23% Asian, 0.03% Pacific Islander, 0.28% from other races, and 0.78% from two or more races. 1.04% of the population were Hispanic or Latino of any race. 57.9% were of German and 10.6% Norwegian ancestry.
There were 8,932 households out of which 32.1% had children under the age of 18 living with them, 54.9% were married couples living together, 7.9% had a female householder with no husband present, and 34.2% were non-families. 29.1% of all households were made up of individuals and 11.9% had someone living alone who was 65 years of age or older. The average household size was 2.44 and the average family size was 3.04.
In the county, the population was spread out with 25.5% under the age of 18, 11.6% from 18 to 24, 26.0% from 25 to 44, 21.4% from 45 to 64, and 15.0% who were 65 years of age or older. The median age was 37 years. For every 100 females there were 97.0 males. For every 100 females age 18 and over, there were 93.0 males.
The median income for a household in the county was $32,526, and the median income for a family was $41,527. Males had a median income of $30,474 versus $20,000 for females. The per capita income for the county was $15,929. About 7.9% of families and 12.3% of the population were below the poverty line, including 11.6% of those under age 18 and 16.7% of those age 65 or over.
2010 census
As of the 2010 United States Census, there were 24,199 people, 10,085 households, and 6,167 families residing in the county.[21] The population density was 18.1 inhabitants per square mile (7.0/km2). There were 10,735 housing units at an average density of 8.0 per square mile (3.1/km2).[22] The racial makeup of the county was 95.2% white, 1.2% Asian, 1.0% American Indian, 0.8% black or African American, 0.5% from other races, and 1.3% from two or more races. Those of Hispanic or Latino origin made up 1.9% of the population.[21] In terms of ancestry, 59.0% were German, 14.7% were Norwegian, 7.7% were Russian, 7.7% were Irish, 7.3% were Czech, 5.4% were English, and 3.5% were American.[23]
Of the 10,085 households, 27.3% had children under the age of 18 living with them, 49.8% were married couples living together, 7.4% had a female householder with no husband present, 38.8% were non-families, and 30.9% of all households were made up of individuals. The average household size was 2.31 and the average family size was 2.90. The median age was 38.3 years.[21]
The median income for a household in the county was $49,536 and the median income for a family was $62,560. Males had a median income of $42,338 versus $26,451 for females. The per capita income for the county was $25,282. About 5.9% of families and 10.0% of the population were below the poverty line, including 12.9% of those under age 18 and 13.1% of those age 65 or over.[24]
Communities
Cities
- Belfield
- Dickinson (county seat)
- Gladstone
- Richardton
- South Heart
- Taylor
Unincorporated communities
Politics
| Year | Republican | Democratic | Third parties |
|---|---|---|---|
| 2016 | 79.2% 9,755 | 14.2% 1,753 | 6.6% 814 |
| 2012 | 73.3% 8,521 | 24.2% 2,812 | 2.6% 300 |
| 2008 | 63.1% 7,024 | 34.2% 3,802 | 2.7% 301 |
| 2004 | 69.4% 7,220 | 29.0% 3,013 | 1.6% 167 |
| 2000 | 65.3% 6,387 | 28.5% 2,784 | 6.2% 606 |
| 1996 | 46.9% 4,086 | 35.6% 3,095 | 17.5% 1,524 |
| 1992 | 42.1% 4,491 | 28.1% 3,003 | 29.8% 3,184 |
| 1988 | 61.4% 6,137 | 36.8% 3,678 | 1.9% 188 |
| 1984 | 71.2% 7,641 | 25.7% 2,759 | 3.2% 340 |
| 1980 | 70.1% 6,312 | 22.4% 2,016 | 7.5% 675 |
| 1976 | 49.9% 4,374 | 46.5% 4,076 | 3.5% 310 |
| 1972 | 62.9% 5,115 | 32.4% 2,636 | 4.7% 380 |
| 1968 | 58.6% 4,365 | 34.6% 2,577 | 6.8% 502 |
| 1964 | 40.3% 2,888 | 59.6% 4,270 | 0.0% 3 |
| 1960 | 43.4% 3,223 | 56.6% 4,197 | 0.0% 1 |
| 1956 | 70.4% 4,251 | 29.4% 1,778 | 0.2% 11 |
| 1952 | 79.6% 5,322 | 19.9% 1,332 | 0.5% 34 |
| 1948 | 60.2% 3,222 | 37.7% 2,017 | 2.2% 118 |
| 1944 | 64.9% 2,852 | 34.9% 1,534 | 0.3% 12 |
| 1940 | 67.6% 4,367 | 32.1% 2,075 | 0.2% 15 |
| 1936 | 26.1% 1,602 | 65.4% 4,012 | 8.6% 525 |
| 1932 | 23.2% 1,443 | 76.8% 4,786 | |
| 1928 | 37.3% 1,924 | 62.6% 3,231 | 0.1% 6 |
| 1924 | 50.6% 2,130 | 6.3% 266 | 43.1% 1,815 |
| 1920 | 86.2% 3,526 | 13.0% 532 | 0.8% 31 |
| 1916 | 58.1% 1,409 | 39.3% 953 | 2.6% 63 |
| 1912 | 22.4% 387 | 39.2% 678 | 38.4% 663 |
| 1908 | 63.8% 922 | 34.3% 496 | 1.9% 28 |
| 1904 | 73.9% 703 | 24.3% 231 | 1.8% 17 |
| 1900 | 64.2% 780 | 35.1% 426 | 0.7% 9 |
See also
References
- 1 2 "State & County QuickFacts". United States Census Bureau. Retrieved November 1, 2013.
- ↑ "Find a County". National Association of Counties. Retrieved 2011-06-07.
- 1 2 3 Long, John H. (2006). "Dakota Territory, South Dakota, and North Dakota: Individual County Chronologies". Dakota Territory Atlas of Historical County Boundaries. The Newberry Library. Archived from the original on 2007-11-11. Retrieved 2008-01-31.
- ↑ "County History". North Dakota.gov. The State of North Dakota. Retrieved February 4, 2015.
- 1 2 3 4 Long, John H. (2006). "North Dakota: Consolidated Chronology of State and County Boundaries". North Dakota Atlas of Historical County Boundaries. The Newberry Library. Archived from the original on 2007-11-27. Retrieved 2008-01-31.
- 1 2 "State of Stark". Bismarck Daily Tribune. Bismarck Daily Tribune. 1899-05-19. p. 3.
- ↑ N. Dak. Laws 1895 , 4th sess., ch. 25/pp. 21–23;
- ↑ Richards v. Stark Co., 8 N.D. 392. , 79 N.W. Rep. 863 (N.D. 1899).
- ↑ "State of Stark". Bismarck Daily Tribune. Bismarck Daily Tribune. 1899-06-19. p. 3.
- ↑ N. Dak. Laws 1899, 6th sess., ch. 57/p. 67
- 1 2 Schaffner v. Young, 10 N.D. 245. , 86 N.W. Rep. 733 (N.D. 1901).
- 1 2 "Act of 1895 and Curative Act of 1899 are Both Unconstitutional and Void". Bismarck Daily Tribune. Bismarck Daily Tribune. 1901-05-24. p. 2.
- ↑ N. Dak. Laws 1903, 8th sess., chs. 68–69/pp. 77–80
- 1 2 State of North Dakota v. Stark County, 14 N.D. 368. , 103 N.W. 913 (N.D. 1905).
- ↑ "2010 Census Gazetteer Files". United States Census Bureau. August 22, 2012. Archived from the original on January 29, 2015. Retrieved February 1, 2015.
- ↑ "Population and Housing Unit Estimates". Retrieved June 9, 2017.
- ↑ "U.S. Decennial Census". United States Census Bureau. Retrieved February 1, 2015.
- ↑ "Historical Census Browser". University of Virginia Library. Retrieved February 1, 2015.
- ↑ Forstall, Richard L., ed. (April 20, 1995). "Population of Counties by Decennial Census: 1900 to 1990". United States Census Bureau. Retrieved February 1, 2015.
- ↑ "Census 2000 PHC-T-4. Ranking Tables for Counties: 1990 and 2000" (PDF). United States Census Bureau. April 2, 2001. Retrieved February 1, 2015.
- 1 2 3 "DP-1 Profile of General Population and Housing Characteristics: 2010 Demographic Profile Data". United States Census Bureau. Retrieved 2016-04-03.
- ↑ "Population, Housing Units, Area, and Density: 2010 - County". United States Census Bureau. Retrieved 2016-04-03.
- ↑ "DP02 SELECTED SOCIAL CHARACTERISTICS IN THE UNITED STATES – 2006-2010 American Community Survey 5-Year Estimates". United States Census Bureau. Retrieved 2016-04-03.
- ↑ "DP03 SELECTED ECONOMIC CHARACTERISTICS – 2006-2010 American Community Survey 5-Year Estimates". United States Census Bureau. Retrieved 2016-04-03.
- ↑ Leip, David. "Dave Leip's Atlas of U.S. Presidential Elections". uselectionatlas.org. Retrieved 2018-04-13.
External links
- Stark County, ND official website
Places adjacent to Stark County, North Dakota | ||||||||||
|---|---|---|---|---|---|---|---|---|---|---|
| ||||||||||
Municipalities and communities of Stark County, North Dakota, United States | ||
|---|---|---|
| Cities | | |
| Unincorporated communities | ||