Williams County, North Dakota
| Williams County, North Dakota | |
|---|---|
 | |
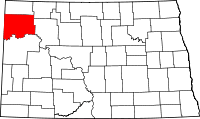 Location in the U.S. state of North Dakota | |
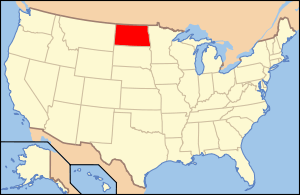 North Dakota's location in the U.S. | |
| Founded | December 8, 1891 |
| Seat | Williston |
| Largest city | Williston |
| Area | |
| • Total | 2,148 sq mi (5,563 km2) |
| • Land | 2,077 sq mi (5,379 km2) |
| • Water | 70 sq mi (181 km2), 3.3% |
| Population (est.) | |
| • (2016) | 34,337 |
| • Density | 11/sq mi (4/km2) |
| Congressional district | At-large |
| Time zone | Central: UTC−6/−5 |
| Website |
www |
Williams County is a county located in the U.S. state of North Dakota. As of the 2010 census, the population was 22,398.[1] Its county seat is Williston.[2] Between 2010 and 2016, according to Census Bureau estimates, it was the second-fastest growing county in the United States, trailing only neighboring McKenzie County, to its south.
The Williston Micropolitan Statistical Area includes all of Williams County. The Micropolitan Statistical Area is the fastest-growing Primary Statistical Area, growing 53.3% in population from 2010 to 2016.
In 2014, Williams County had the lowest percentage of unemployed people of any county in the United States, at 1.2 percent.[3]
History
There have been two Williams counties in the history of North Dakota. The first, created in 1873, was located south of the Missouri River near where Dunn and Mercer counties are today. The second Williams County was established by the 1891 state legislature and consists of the contemporary Williams and Divide counties. The name comes from Erastus Appelman Williams, an early politician from Bismarck who served in both the territorial and state legislatures. The county government was first organized on December 8, 1891; Williston has always been the county seat.[4]
Geography
According to the U.S. Census Bureau, the county has a total area of 2,148 square miles (5,560 km2), of which 2,077 square miles (5,380 km2) is land and 70 square miles (180 km2) (3.3%) is water.[5] It is the fourth-largest county in North Dakota by area.
Lake Sakakawea, a reservoir on the Missouri River, is situated on the southern boundary of the county. Little Muddy Creek is entirely within Williams County. The confluence of the Yellowstone River with the Missouri is west of Williston.
The Fort Union Trading Post National Historic Site is located in Williams County along the Missouri River on the Montana border.
Williams County is one of several western North Dakota counties with significant exposure to the Bakken formation in the Williston Basin.
Adjacent counties
- Divide County (north)
- Burke County (northeast)
- Mountrail County (east)
- McKenzie County (south)
- Roosevelt County, Montana (southwest)
- Sheridan County, Montana (west)
Major highways
National protected areas
Demographics
| Historical population | |||
|---|---|---|---|
| Census | Pop. | %± | |
| 1880 | 14 | — | |
| 1890 | 109 | 678.6% | |
| 1900 | 1,530 | 1,303.7% | |
| 1910 | 14,234 | 830.3% | |
| 1920 | 17,980 | 26.3% | |
| 1930 | 19,553 | 8.7% | |
| 1940 | 16,315 | −16.6% | |
| 1950 | 16,442 | 0.8% | |
| 1960 | 22,051 | 34.1% | |
| 1970 | 19,301 | −12.5% | |
| 1980 | 22,237 | 15.2% | |
| 1990 | 21,129 | −5.0% | |
| 2000 | 19,761 | −6.5% | |
| 2010 | 22,398 | 13.3% | |
| Est. 2016 | 34,337 | [6] | 53.3% |
| U.S. Decennial Census[7] 1790-1960[8] 1900-1990[9] 1990-2000[10] 2010-2016[1] | |||
2000 census
As of the census of 2000, there were 19,761 people, 8,095 households, and 5,261 families residing in the county. The population density was 10 people per square mile (4/km²). There were 9,680 housing units at an average density of 5 per square mile (2/km²). The racial makeup of the county was 92.95% White, 0.12% Black or African American, 4.40% Native American, 0.18% Asian, 0.01% Pacific Islander, 0.14% from other races, and 2.21% from two or more races. 0.94% of the population were Hispanic or Latino of any race. 48.3% were of Norwegian and 22.0% German ancestry.
There were 8,095 households out of which 31.2% had children under the age of 18 living with them, 53.3% were married couples living together, 8.8% had a female householder with no husband present, and 35.0% were non-families. Of all households 30.9% were made up of individuals and 13.1% had someone living alone who was 65 years of age or older. The average household size was 2.38 and the average family size was 2.99.
In the county, the population was spread out with 26.2% under the age of 18, 7.80% from 18 to 24, 25.5% from 25 to 44, 24.0% from 45 to 64, and 16.5% who were 65 years of age or older. The median age was 40 years. For every 100 females there were 96.2 males. For every 100 females age 18 and over, there were 93.6 males.
The median income for a household in the county was $31,491, and the median income for a family was $39,065. Males had a median income of $29,884 versus $19,329 for females. The per capita income for the county was $16,763. About 9.6% of families and 11.9% of the population were below the poverty line, including 16.5% of those under age 18 and 8.1% of those age 65 or over.
2010 census
As of the 2010 United States Census, there were 22,398 people, 9,293 households, and 5,746 families residing in the county.[11] The population density was 10.8 inhabitants per square mile (4.2/km2). There were 10,464 housing units at an average density of 5.0 per square mile (1.9/km2).[12] The racial makeup of the county was 92.1% white, 4.0% American Indian, 0.4% Asian, 0.3% black or African American, 0.3% from other races, and 2.9% from two or more races. Those of Hispanic or Latino origin made up 1.9% of the population.[11] In terms of ancestry, 46.2% were of Norwegian, 35.9% of German, 9.8% of Irish, 4.5% of Swedish and 4.4% of English ancestry.[13]
Of the 9,293 households, 28.5% had children under the age of 18 living with them, 49.8% were married couples living together, 7.7% had a female householder with no husband present, 38.2% were non-families, and 31.5% of all households were made up of individuals. The average household size was 2.35 and the average family size was 2.95. The median age was 39.0 years.[11]
The median income for a household in the county was $55,396 and the median income for a family was $67,875. Males had a median income of $50,735 versus $27,071 for females. The per capita income for the county was $29,153. About 4.7% of families and 8.7% of the population were below the poverty line, including 9.7% of those under age 18 and 10.4% of those age 65 or over.[14]
Media
- The Williston Herald
Communities
Cities
Townships
- Athens
- Barr Butte
- Big Meadow
- Big Stone
- Blacktail
- Blue Ridge
- Bonetraill
- Brooklyn
- Buford
- Bull Butte
- Champion
- Climax
- Cow Creek
- Dry Fork
- Dublin
- East Fork
- Ellisville
- Equality
- Farmvale
- Golden Valley
- Good Luck
- Grenora
- Hardscrabble
- Hazel
- Hebron
- Judson
- Lindahl
- Marshall
- Missouri Ridge
- Mont
- New Home
- Oliver
- Orthell
- Pherrin
- Pleasant Valley
- Rainbow
- Rock Island
- Round Prairie
- Sauk Valley
- Scorio
- South Meadow
- Springbrook
- Stony Creek
- Strandahl
- Tioga
- Trenton
- Truax
- Twelve Mile
- Tyrone
- View
- West Bank
- Wheelock
- Williston
- Winner
Defunct townships
- Hofflund[15]
Unincorporated communities
Politics
| Year | Republican | Democratic | Third parties |
|---|---|---|---|
| 2016 | 78.6% 10,069 | 13.6% 1,735 | 7.8% 1,003 |
| 2012 | 73.3% 7,184 | 23.7% 2,322 | 3.1% 302 |
| 2008 | 67.1% 6,291 | 31.2% 2,921 | 1.7% 161 |
| 2004 | 70.3% 6,278 | 28.1% 2,512 | 1.6% 139 |
| 2000 | 66.4% 5,187 | 29.9% 2,330 | 3.7% 290 |
| 1996 | 45.8% 3,590 | 38.5% 3,018 | 15.7% 1,232 |
| 1992 | 37.0% 3,664 | 30.3% 3,008 | 32.7% 3,245 |
| 1988 | 57.9% 5,653 | 41.0% 4,004 | 1.1% 111 |
| 1984 | 70.9% 8,166 | 27.6% 3,177 | 1.6% 180 |
| 1980 | 65.9% 6,530 | 25.7% 2,545 | 8.4% 829 |
| 1976 | 48.7% 4,230 | 48.2% 4,189 | 3.1% 273 |
| 1972 | 59.9% 4,800 | 37.3% 2,989 | 2.8% 225 |
| 1968 | 51.5% 3,980 | 42.2% 3,263 | 6.3% 483 |
| 1964 | 36.5% 3,076 | 63.4% 5,352 | 0.1% 11 |
| 1960 | 49.0% 4,492 | 51.0% 4,683 | 0.0% 2 |
| 1956 | 50.1% 4,188 | 49.7% 4,157 | 0.2% 19 |
| 1952 | 58.5% 4,307 | 40.7% 2,999 | 0.8% 61 |
| 1948 | 38.8% 2,133 | 46.8% 2,571 | 14.4% 791 |
| 1944 | 36.6% 2,217 | 61.8% 3,748 | 1.6% 98 |
| 1940 | 34.3% 2,470 | 63.5% 4,579 | 2.3% 162 |
| 1936 | 13.7% 1,021 | 65.6% 4,903 | 20.7% 1,549 |
| 1932 | 21.9% 1,509 | 70.1% 4,823 | 8.0% 552 |
| 1928 | 57.3% 3,591 | 39.9% 2,503 | 2.8% 178 |
| 1924 | 36.8% 1,865 | 6.1% 308 | 57.2% 2,900 |
| 1920 | 65.3% 3,768 | 23.1% 1,330 | 11.6% 671 |
| 1916 | 28.3% 903 | 55.4% 1,769 | 16.3% 521 |
| 1912 | 24.1% 549 | 30.5% 696 | 45.4% 1,035[17] |
| 1908 | 60.4% 1,979 | 31.6% 1,034 | 8.0% 263 |
| 1904 | 70.9% 825 | 27.2% 316 | 1.9% 22 |
| 1900 | 72.0% 249 | 27.5% 95 | 0.6% 2 |
See also
References
- 1 2 "State & County QuickFacts". United States Census Bureau. Retrieved November 1, 2013.
- ↑ "Find a County". National Association of Counties. Retrieved 2011-06-07.
- ↑ "Labor Force Data by County, 2014 Annual Averages". U.S. Bureau of Labor Statistics. Retrieved July 2015. Check date values in:
|accessdate=(help) - ↑ "County History". Official Portal for North Dakota State Government. Retrieved 4 May 2011.
- ↑ "2010 Census Gazetteer Files". United States Census Bureau. August 22, 2012. Archived from the original on January 29, 2015. Retrieved February 1, 2015.
- ↑ "Population and Housing Unit Estimates". Retrieved June 9, 2017.
- ↑ "U.S. Decennial Census". United States Census Bureau. Retrieved February 1, 2015.
- ↑ "Historical Census Browser". University of Virginia Library. Retrieved February 1, 2015.
- ↑ Forstall, Richard L., ed. (April 20, 1995). "Population of Counties by Decennial Census: 1900 to 1990". United States Census Bureau. Retrieved February 1, 2015.
- ↑ "Census 2000 PHC-T-4. Ranking Tables for Counties: 1990 and 2000" (PDF). United States Census Bureau. April 2, 2001. Retrieved February 1, 2015.
- 1 2 3 "DP-1 Profile of General Population and Housing Characteristics: 2010 Demographic Profile Data". United States Census Bureau. Retrieved 2016-04-03.
- ↑ "Population, Housing Units, Area, and Density: 2010 - County". United States Census Bureau. Retrieved 2016-04-03.
- ↑ "DP02 SELECTED SOCIAL CHARACTERISTICS IN THE UNITED STATES – 2006-2010 American Community Survey 5-Year Estimates". United States Census Bureau. Retrieved 2016-04-03.
- ↑ "DP03 SELECTED ECONOMIC CHARACTERISTICS – 2006-2010 American Community Survey 5-Year Estimates". United States Census Bureau. Retrieved 2016-04-03.
- ↑ U.S. Census Bureau: Boundary Changes
- ↑ Leip, David. "Dave Leip's Atlas of U.S. Presidential Elections". uselectionatlas.org. Retrieved 2018-04-13.
- ↑ The leading "other" candidate, Socialist Eugene Debs received 588 votes, while Progressive Theodore Roosevelt, received 402 votes, Prohibition candidate Eugene Chafin received 45 votes.
Places adjacent to Williams County, North Dakota | ||||||||||
|---|---|---|---|---|---|---|---|---|---|---|
| ||||||||||
Municipalities and communities of Williams County, North Dakota, United States | ||
|---|---|---|
| Cities | | |
| Townships |
| |
| Unorganized territories |
| |
| Unincorporated communities | ||
| Indian reservation | ||
| Footnotes | ‡This populated place also has portions in an adjacent county or counties | |