Clearwater County, Minnesota
| Clearwater County, Minnesota | |
|---|---|
|
Clearwater County Building and Courthouse in Bagley, Minnesota. | |
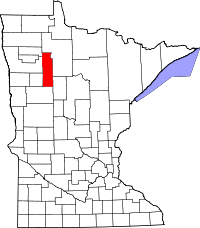 Location in the U.S. state of Minnesota | |
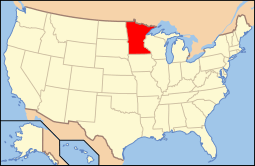 Minnesota's location in the U.S. | |
| Founded | December 20, 1902[1] |
| Named for | Clearwater Lake and Clearwater River[2] |
| Seat | Bagley |
| Largest city | Bagley |
| Area | |
| • Total | 1,030 sq mi (2,668 km2) |
| • Land | 999 sq mi (2,587 km2) |
| • Water | 31 sq mi (80 km2), 3.0% |
| Population (est.) | |
| • (2016) | 8,827 |
| • Density | 8.7/sq mi (3.4/km2) |
| Congressional district | 7th |
| Time zone | Central: UTC−6/−5 |
| Website |
www |
Clearwater County is a rural county in the state of Minnesota. As of the 2010 census, the population was 8,695.[3] Its county seat is Bagley.[4]
Clearwater County is home to Lake Itasca, the source of the Mississippi River. Parts of the Red Lake and White Earth Indian reservations extend into the county.
Geography
According to the U.S. Census Bureau, the county has a total area of 1,030 square miles (2,700 km2), of which 999 square miles (2,590 km2) is land and 31 square miles (80 km2) (3.0%) is water.[5]
Major highways
Adjacent counties
- Beltrami County (northeast)
- Hubbard County (southeast)
- Becker County (south)
- Mahnomen County (southwest)
- Polk County (northwest)
- Pennington County (northwest)
Places adjacent to Clearwater County, Minnesota | ||||||||||
|---|---|---|---|---|---|---|---|---|---|---|
| ||||||||||
Climate and weather
| Bagley, Minnesota | ||||||||||||||||||||||||||||||||||||||||||||||||||||||||||||
|---|---|---|---|---|---|---|---|---|---|---|---|---|---|---|---|---|---|---|---|---|---|---|---|---|---|---|---|---|---|---|---|---|---|---|---|---|---|---|---|---|---|---|---|---|---|---|---|---|---|---|---|---|---|---|---|---|---|---|---|---|
| Climate chart (explanation) | ||||||||||||||||||||||||||||||||||||||||||||||||||||||||||||
| ||||||||||||||||||||||||||||||||||||||||||||||||||||||||||||
| ||||||||||||||||||||||||||||||||||||||||||||||||||||||||||||
In recent years, average temperatures in the county seat of Bagley have ranged from a low of −5 °F (−21 °C) in January to a high of 79 °F (26 °C) in July, although a record low of −53 °F (−47 °C) was recorded in February 1996 and a record high of 103 °F (39 °C) was recorded in August 1976. Average monthly precipitation ranged from 0.64 inches (16 mm) in December to 4.62 inches (117 mm) in June.[7]
Demographics
| Historical population | |||
|---|---|---|---|
| Census | Pop. | %± | |
| 1910 | 6,870 | — | |
| 1920 | 8,569 | 24.7% | |
| 1930 | 9,546 | 11.4% | |
| 1940 | 11,153 | 16.8% | |
| 1950 | 10,204 | −8.5% | |
| 1960 | 8,864 | −13.1% | |
| 1970 | 8,013 | −9.6% | |
| 1980 | 8,761 | 9.3% | |
| 1990 | 8,309 | −5.2% | |
| 2000 | 8,423 | 1.4% | |
| 2010 | 8,695 | 3.2% | |
| Est. 2016 | 8,827 | [8] | 1.5% |
| U.S. Decennial Census[9] 1790-1960[10] 1900-1990[11] 1990-2000[12] 2010-2016[3] | |||
As of the 2000 census, there were 8,423 people, 3,330 households, and 2,287 families residing in the county. The population density was 8 people per square mile (3/km²). There were 4,114 housing units at an average density of 4 per square mile (2/km²). The racial makeup of the county was 89.26% White, 0.19% Black or African American, 8.58% Native American, 0.25% Asian, 0.01% Pacific Islander, 0.24% from other races, and 1.47% from two or more races. 0.77% of the population were Hispanic or Latino of any race. 43.6% were of Norwegian, 15.6% German, 6.5% Swedish, and 6.2% American ancestry.
There were 3,330 households out of which 30.60% had children under the age of 18 living with them, 56.80% were married couples living together, 7.50% had a female householder with no husband present, and 31.30% were non-families. 27.90% of all households were made up of individuals and 14.50% had someone living alone who was 65 years of age or older. The average household size was 2.48 and the average family size was 3.02.
In the county, the population was spread out with 26.00% under the age of 18, 7.60% from 18 to 24, 24.60% from 25 to 44, 24.30% from 45 to 64, and 17.50% who were 65 years of age or older. The median age was 40 years. For every 100 females there were 101.10 males. For every 100 females age 18 and over, there were 100.30 males.
The median income for a household in the county was $30,517, and the median income for a family was $39,698. Males had a median income of $29,338 versus $20,417 for females. The per capita income for the county was $15,694. About 11.00% of families and 15.10% of the population were below the poverty line, including 18.90% of those under age 18 and 18.20% of those age 65 or over.
Communities
Cities
- Bagley (county seat)
- Clearbrook
- Gonvick
- Leonard
- Shevlin
Townships
- Bear Creek Township
- Clover Township
- Copley Township
- Dudley Township
- Eddy Township
- Falk Township
- Greenwood Township
- Hangaard Township
- Holst Township
- Itasca Township
- La Prairie Township
- Leon Township
- Long Lost Lake Township
- Minerva Township
- Moose Creek Township
- Nora Township
- Pine Lake Township
- Popple Township
- Rice Township
- Shevlin Township
- Sinclair Township
- Winsor Township
Census-designated places
Unincorporated communities
Unorganized territories
Politics
| Year | Republican | Democratic | Third parties |
|---|---|---|---|
| 2016 | 68.9% 2,925 | 25.9% 1,100 | 5.2% 220 |
| 2012 | 56.2% 2,359 | 41.8% 1,753 | 2.0% 85 |
| 2008 | 53.8% 2,291 | 44.1% 1,877 | 2.2% 93 |
| 2004 | 55.9% 2,438 | 42.9% 1,871 | 1.2% 52 |
| 2000 | 55.9% 2,137 | 38.3% 1,466 | 5.8% 221 |
| 1996 | 40.5% 1,423 | 44.9% 1,578 | 14.6% 513 |
| 1992 | 35.0% 1,315 | 42.2% 1,587 | 22.8% 856 |
| 1988 | 49.4% 1,763 | 49.6% 1,769 | 1.0% 35 |
| 1984 | 51.3% 2,066 | 47.6% 1,917 | 1.0% 42 |
| 1980 | 46.4% 1,919 | 47.3% 1,955 | 6.4% 263 |
| 1976 | 34.2% 1,374 | 60.7% 2,437 | 5.1% 204 |
| 1972 | 49.4% 1,819 | 47.5% 1,751 | 3.1% 113 |
| 1968 | 36.1% 1,284 | 57.5% 2,046 | 6.5% 231 |
| 1964 | 30.4% 1,137 | 69.4% 2,596 | 0.2% 6 |
| 1960 | 39.9% 1,651 | 59.6% 2,466 | 0.4% 18 |
| 1956 | 40.1% 1,464 | 59.5% 2,171 | 0.4% 15 |
| 1952 | 47.9% 1,971 | 50.8% 2,089 | 1.4% 56 |
| 1948 | 27.8% 1,171 | 66.3% 2,793 | 5.9% 248 |
| 1944 | 29.5% 1,125 | 69.6% 2,658 | 0.9% 34 |
| 1940 | 28.9% 1,354 | 70.3% 3,289 | 0.8% 35 |
| 1936 | 22.1% 939 | 75.3% 3,208 | 2.6% 111 |
| 1932 | 22.9% 845 | 72.8% 2,688 | 4.3% 159 |
| 1928 | 60.0% 1,898 | 37.6% 1,189 | 2.4% 76 |
| 1924 | 37.5% 1,020 | 3.2% 86 | 59.3% 1,611 |
| 1920 | 70.7% 1,788 | 13.5% 340 | 15.8% 400 |
| 1916 | 39.9% 493 | 44.1% 544 | 16.0% 198 |
| 1912 | 11.4% 125 | 11.2% 123 | 77.4% 847 |
| 1908 | 66.1% 779 | 13.9% 164 | 20.0% 236 |
| 1904 | 85.3% 903 | 7.5% 79 | 7.3% 77 |
See also
References
- ↑ "Minnesota Place Names". Minnesota Historical Society. Retrieved March 17, 2014.
- ↑ Upham, Warren (1920). Minnesota Geographic Names: Their Origin and Historic Significance. Minnesota Historical Society. p. 121.
- 1 2 "State & County QuickFacts". United States Census Bureau. Retrieved August 31, 2013.
- ↑ "Find a County". National Association of Counties. Archived from the original on 2011-05-31. Retrieved 2011-06-07.
- ↑ "2010 Census Gazetteer Files". United States Census Bureau. August 22, 2012. Archived from the original on October 6, 2014. Retrieved October 6, 2014.
- ↑ Nelson, Steven (2011). Savanna Soils of Minnesota. Minnesota: Self. pp. 57 - 60. ISBN 978-0-615-50320-2.
- 1 2 "Monthly Averages for Bagley, Minnesota". The Weather Channel. Retrieved 2011-11-06.
- ↑ "Population and Housing Unit Estimates". Retrieved June 9, 2017.
- ↑ "U.S. Decennial Census". United States Census Bureau. Archived from the original on May 12, 2015. Retrieved October 6, 2014.
- ↑ "Historical Census Browser". University of Virginia Library. Retrieved October 6, 2014.
- ↑ "Population of Counties by Decennial Census: 1900 to 1990". United States Census Bureau. Retrieved October 6, 2014.
- ↑ "Census 2000 PHC-T-4. Ranking Tables for Counties: 1990 and 2000" (PDF). United States Census Bureau. Retrieved October 6, 2014.
- ↑ Leip, David. "Dave Leip's Atlas of U.S. Presidential Elections". uselectionatlas.org. Retrieved 2018-04-17.
External links
Municipalities and communities of Clearwater County, Minnesota, United States | ||
|---|---|---|
| Cities | ||
| Townships | ||
| CDPs | ||
| Unorganized territories | ||
| Unincorporated communities | ||
| Indian reservations | ||
| Ghost town | ||
| Footnotes | ‡This populated place also has portions in an adjacent county or counties | |