Divide County, North Dakota
Divide County is a county in the U.S. state of North Dakota. As of the 2010 United States Census, the population was 2,071.[1] Its county seat is Crosby.[2]
Divide County | |
|---|---|
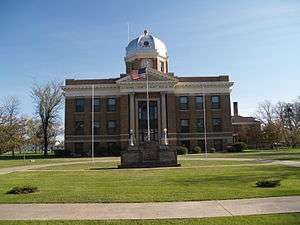 Divide County Courthouse in Crosby | |
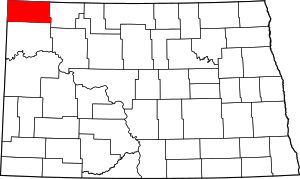 Location within the U.S. state of North Dakota | |
 North Dakota's location within the U.S. | |
| Coordinates: 48°49′N 103°29′W | |
| Country | |
| State | |
| Founded | 1910 |
| Seat | Crosby |
| Largest city | Crosby |
| Area | |
| • Total | 1,294 sq mi (3,350 km2) |
| • Land | 1,261 sq mi (3,270 km2) |
| • Water | 33 sq mi (90 km2) 2.6% |
| Population (2010) | |
| • Total | 2,071 |
| • Estimate (2019) | 2,264 |
| • Density | 1.6/sq mi (0.62/km2) |
| Time zone | UTC−6 (Central) |
| • Summer (DST) | UTC−5 (CDT) |
| Congressional district | At-large |
| Website | www |
History
In November 8, 1910 election, the voters of Williams County voters determined that the county should be divided into a northern and a southern county. The vote was affirmative; the southern portion retained the Williams name; the newly created county was named "Divide", with Crosby as the seat. The county government was effected on December 9 of that year, and the county's boundaries have remained unchanged since that time. Most histories attribute the county name to its "division" from Williams County,[3] though the county's location on the Laurentian Divide, separating runoff waters between Hudson Bay and Gulf of Mexico, may have been involved.[4]
Geography
Divide County lies at the NW corner of North Dakota. Its northern boundary line abuts the south boundary line of Canada and its west boundary line abuts the east boundary line of the state of Montana. Its terrain consists of semi-arid rolling hills, dotted with lakes and ponds, partially devoted to agriculture.[5] The terrain generally slopes to the east; the northern part also slopes to the north while the southern part slopes to the south.[6] The county has a total area of 1,294 square miles (3,350 km2), of which 1,261 square miles (3,270 km2) is land and 33 square miles (85 km2) (2.6%) is water.[7]
Divide County is one of several western North Dakota counties with significant exposure to the Bakken Formation in the Williston Basin.
Major highways


Adjacent counties and rural municipalities
- Lake Alma No. 8, Saskatchewan - northwest
- Souris Valley No. 7, Saskatchewan - north
- Cambria No. 6, Saskatchewan - north
- Estevan No. 5, Saskatchewan - northeast
- Burke County - east
- Williams County - south
- Sheridan County, Montana - west
Lakes[5]
- Bright Water Lake
- McCone Lake
- Miller Lake
- Musta Lake
- North Lake
- Rattler Lake
- Round Lake (part)
- Willow Lake
Demographics
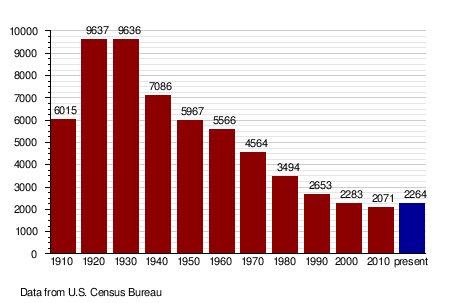
| Historical population | |||
|---|---|---|---|
| Census | Pop. | %± | |
| 1910 | 6,015 | — | |
| 1920 | 9,637 | 60.2% | |
| 1930 | 9,636 | 0.0% | |
| 1940 | 7,086 | −26.5% | |
| 1950 | 5,967 | −15.8% | |
| 1960 | 5,566 | −6.7% | |
| 1970 | 4,564 | −18.0% | |
| 1980 | 3,494 | −23.4% | |
| 1990 | 2,899 | −17.0% | |
| 2000 | 2,283 | −21.2% | |
| 2010 | 2,071 | −9.3% | |
| Est. 2019 | 2,264 | [8] | 9.3% |
| US Decennial Census[9] 1790-1960[10] 1900-1990[11] 1990-2000[12] 2010-2019[1] | |||
2000 census
As of the 2000 United States Census, there were 2,283 people, 1,005 households, and 649 families in the county. The population density was 1.8 people per square mile (0.7/km²). There were 1,469 housing units at an average density of 1.2 per square mile (0.4/km²). The racial makeup of the county was 98.99% White, 0.13% Native American, 0.53% Asian, 0.18% from other races, and 0.18% from two or more races. 0.61% of the population were Hispanic or Latino of any race.
There were 1,005 households out of which 22.5% had children under the age of 18 living with them, 56.8% were married couples living together, 4.2% had a female householder with no husband present, and 35.4% were non-families. 33.4% of all households were made up of individuals and 19.9% had someone living alone who was 65 years of age or older. The average household size was 2.18 and the average family size was 2.79.
The county population contained 20.2% under the age of 18, 3.6% from 18 to 24, 20.1% from 25 to 44, 26.6% from 45 to 64, and 29.5% who were 65 years of age or older. The median age was 49 years. For every 100 females there were 100.8 males. For every 100 females age 18 and over, there were 97.5 males.
The median income for a household in the county was $30,089, and the median income for a family was $39,292. Males had a median income of $28,333 versus $16,371 for females. The per capita income for the county was $16,225. About 9.5% of families and 14.6% of the population were below the poverty line, including 19.5% of those under age 18 and 14.7% of those age 65 or over.
The largest ancestries are Norwegian (64.7%), German (24.0%), Swedish (8.8%), and Irish (5.9%).
Among the population claiming adherence to a particular religious organization, 80.6% claimed adherence to the Evangelical Lutheran Church in America (ELCA) in 2010. This rate is the highest such rate for the ELCA among all counties in the United States.[13]
2010 census
As of the 2010 United States Census, there were 2,071 people, 977 households, and 584 families in the county.[14] The population density was 1.6 inhabitants per square mile (0.62/km2). There were 1,324 housing units at an average density of 1.1 per square mile (0.42/km2).[15] The racial makeup of the county was 98.0% white, 0.5% American Indian, 0.3% Asian, 0.2% black or African American, 0.0% from other races, and 0.8% from two or more races. Those of Hispanic or Latino origin made up 1.4% of the population.[14] In terms of ancestry, 57.7% were Norwegian, 30.3% were German, 8.5% were Irish, 5.2% were Swedish, and 2.9% were American.[16]
Of the 977 households, 19.8% had children under the age of 18 living with them, 51.2% were married couples living together, 4.5% had a female householder with no husband present, 40.2% were non-families, and 36.6% of all households were made up of individuals. The average household size was 2.05 and the average family size was 2.66. The median age was 51.4 years.[14]
The median income for a household in the county was $48,152 and the median income for a family was $65,000. Males had a median income of $42,341 versus $27,596 for females. The per capita income for the county was $28,462. About 9.4% of families and 14.0% of the population were below the poverty line, including 40.7% of those under age 18 and 5.7% of those age 65 or over.[17]
Population by decade
Places of interest
Two petroglyphs are displayed at Writing Rock State Historical Site in Writing Rock Township.
Communities
Towns
- Westby, Montana (part)
Townships
- Alexandria
- Ambrose
- Blooming Prairie
- Blooming Valley
- Border
- Burg
- Clinton
- Coalfield
- Daneville
- De Witt
- Elkhorn
- Fertile Valley
- Fillmore
- Frazier
- Frederick
- Garnet
- Gooseneck
- Hawkeye
- Hayland
- Lincoln Valley
- Long Creek
- Mentor
- Palmer
- Plumer
- Sioux Trail
- Smoky Butte
- Stoneview
- Troy
- Twin Butte
- Upland
- Westby
- Writing Rock
Politics
Divide County has been a swing county, with a Republican tendency. Since 1960 the county has selected the Republican Party candidate in 64% of the national elections (as of 2016).
| Year | Republican | Democratic | Third parties |
|---|---|---|---|
| 2016 | 71.1% 867 | 20.1% 245 | 8.8% 107 |
| 2012 | 63.1% 733 | 33.1% 385 | 3.8% 44 |
| 2008 | 55.7% 630 | 41.0% 464 | 3.3% 37 |
| 2004 | 59.2% 751 | 38.4% 487 | 2.4% 30 |
| 2000 | 55.8% 443 | 38.5% 306 | 5.7% 45 |
| 1996 | 36.4% 488 | 47.5% 637 | 16.1% 215 |
| 1992 | 31.8% 515 | 39.1% 634 | 29.1% 471 |
| 1988 | 49.2% 869 | 49.5% 875 | 1.4% 24 |
| 1984 | 63.3% 1,165 | 34.0% 626 | 2.7% 49 |
| 1980 | 66.1% 1,267 | 26.5% 509 | 7.4% 142 |
| 1976 | 44.5% 881 | 53.4% 1,057 | 2.0% 40 |
| 1972 | 60.3% 1,230 | 37.9% 774 | 1.8% 36 |
| 1968 | 50.4% 1,032 | 44.6% 914 | 5.0% 102 |
| 1964 | 34.2% 779 | 65.7% 1,498 | 0.2% 4 |
| 1960 | 52.0% 1,348 | 47.9% 1,243 | 0.2% 4 |
| 1956 | 52.0% 1,296 | 47.9% 1,194 | 0.1% 3 |
| 1952 | 70.8% 1,999 | 28.6% 807 | 0.6% 18 |
| 1948 | 48.1% 981 | 43.5% 887 | 8.3% 170 |
| 1944 | 44.2% 1,225 | 54.6% 1,513 | 1.2% 34 |
| 1940 | 44.3% 1,437 | 54.6% 1,771 | 1.1% 34 |
| 1936 | 16.5% 585 | 62.6% 2,212 | 20.9% 739 |
| 1932 | 24.0% 817 | 69.8% 2,374 | 6.2% 211 |
| 1928 | 60.4% 1,963 | 38.4% 1,250 | 1.2% 39 |
| 1924 | 30.4% 743 | 3.7% 91 | 65.8% 1,608 |
| 1920 | 80.8% 2,438 | 15.3% 462 | 3.9% 117 |
| 1916 | 39.4% 707 | 53.0% 950 | 7.6% 137 |
| 1912 | 28.6% 404 | 26.5% 375 | 44.9% 634 |
See also
- National Register of Historic Places listings in Divide County, North Dakota
- Westby, Montana was founded in North Dakota in Divide County and then was moved to Montana.
References
- "State & County QuickFacts". United States Census Bureau. Archived from the original on June 7, 2011. Retrieved October 31, 2013.
- "Find a County". National Association of Counties. Archived from the original on May 31, 2011. Retrieved June 7, 2011.
- "County History". Official Portal for North Dakota State Government. Archived from the original on February 2, 2015. Retrieved May 4, 2011.
- "Dakota Territory, South Dakota, and North Dakota: Individual County Chronologies". Dakota Territory Atlas of Historical County Boundaries. The Newberry Library. 2006. Retrieved February 1, 2015.
- Divide County ND Google Maps (accessed February 17, 2019)
- ""Find an Altitude/Divide County ND" Google Maps (accessed February 17, 2019)". Archived from the original on May 21, 2019. Retrieved February 17, 2019.
- "2010 Census Gazetteer Files". US Census Bureau. August 22, 2012. Archived from the original on January 29, 2015. Retrieved January 28, 2015.
- "Population and Housing Unit Estimates". Retrieved April 6, 2020.
- "US Decennial Census". US Census Bureau. Retrieved January 28, 2015.
- "Historical Census Browser". University of Virginia Library. Retrieved January 28, 2015.
- Forstall, Richard L., ed. (March 27, 1995). "Population of Counties by Decennial Census: 1900 to 1990". US Census Bureau. Retrieved January 28, 2015.
- "Census 2000 PHC-T-4. Ranking Tables for Counties: 1990 and 2000" (PDF). US Census Bureau. April 2, 2001. Retrieved January 28, 2015.
- "2010 US Religion Census: Religious Congregations & Membership Study - Links and Rankings (All Years)". Association of Statisticians of American Religious Bodies. 2010. Retrieved January 19, 2014.
- "Profile of General Population and Housing Characteristics: 2010 Demographic Profile Data". US Census Bureau. Archived from the original on February 13, 2020. Retrieved March 14, 2016.
- "Population, Housing Units, Area, and Density: 2010 - County". US Census Bureau. Archived from the original on February 13, 2020. Retrieved March 14, 2016.
- "Selected Social Characteristics in the US – 2006-2010 American Community Survey 5-Year Estimates". US Census Bureau. Archived from the original on February 13, 2020. Retrieved March 14, 2016.
- "Selected Economic Characteristics – 2006-2010 American Community Survey 5-Year Estimates". US Census Bureau. Archived from the original on February 13, 2020. Retrieved March 14, 2016.
- Leip, David. "Atlas of US Presidential Elections". uselectionatlas.org. Retrieved April 12, 2018.
External links
- Stories and histories of Divide County (1964) from the Digital Horizons website
- Divide County map, North Dakota DOT
Places adjacent to Divide County, North Dakota | |
|---|---|
Municipalities and communities of Divide County, North Dakota, United States | ||
|---|---|---|
| Cities | Map of North Dakota highlighting Divide County | |
| Townships |
| |
| Unincorporated communities | ||
| Indian reservation | ||
| Footnotes | ‡This populated place also has portions in an adjacent county or counties | |

| Authority control |
|
|---|