Logan County, North Dakota
Logan County is a county in the U.S. state of North Dakota. As of the 2010 United States Census, the population was 1,990.[1] Its county seat is Napoleon.[2]
Logan County | |
|---|---|
 Winter view of downtown Napoleon, North Dakota. | |
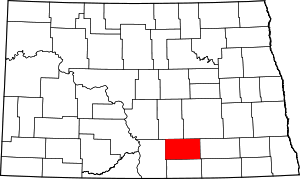 Location within the U.S. state of North Dakota | |
 North Dakota's location within the U.S. | |
| Coordinates: 46°27′N 99°29′W | |
| Country | |
| State | |
| Founded | January 4, 1873 (created) September 1, 1884 (organized) |
| Named for | John A. Logan |
| Seat | Napoleon |
| Largest city | Napoleon |
| Area | |
| • Total | 1,011 sq mi (2,620 km2) |
| • Land | 993 sq mi (2,570 km2) |
| • Water | 18 sq mi (50 km2) 1.8% |
| Population (2010) | |
| • Total | 1,990 |
| • Estimate (2019) | 1,850 |
| • Density | 2.0/sq mi (0.76/km2) |
| Time zone | UTC−6 (Central) |
| • Summer (DST) | UTC−5 (CDT) |
| Congressional district | At-large |
| Website | logancountynd |
History
The Dakota Territory legislature created the county on January 4, 1873. It was named for John A. Logan (1826-1886), a Civil War general and United States Senator from Illinois.[3] The county government was not organized at that time, but the county was not attached to another county for administrative or judicial purposes. The county government organization was effected on September 1, 1884.
The county's boundaries were altered in 1883. They have remained in the present configuration since that time.[4] Napoleon was the county seat from 1884 to 1899. King became the county seat briefly in 1899 before Napoleon once again was given that title.[5]
Geography
The Logan County terrain consists of rolling hills, dotted with lakes and ponds. The area is largely devoted to agriculture.[6] The terrain slopes to the east, with its highest point near its SW corner at 2,133' (650m) ASL.[7] The county has a total area of 1,011 square miles (2,620 km2), of which 933 square miles (2,420 km2) is land and 1.8 square miles (4.7 km2) (2.0%) is water.[8]
Major highways
Adjacent counties
- Stutsman County - northeast
- LaMoure County - east
- McIntosh County - south
- Emmons County - west
- Kidder County - northwest
Protected areas[6]
- Arnies Lake
- Beaver Lake
- Doyles Lake
- Fish Lake (part)
- Island Lake
- McKenna Lake
- Red Lake
- Round Lake
Protected areas[6]
- Beaver Lake State Park
Demographics
| Historical population | |||
|---|---|---|---|
| Census | Pop. | %± | |
| 1890 | 597 | — | |
| 1900 | 1,625 | 172.2% | |
| 1910 | 6,168 | 279.6% | |
| 1920 | 7,723 | 25.2% | |
| 1930 | 8,089 | 4.7% | |
| 1940 | 7,561 | −6.5% | |
| 1950 | 6,357 | −15.9% | |
| 1960 | 5,369 | −15.5% | |
| 1970 | 4,245 | −20.9% | |
| 1980 | 3,493 | −17.7% | |
| 1990 | 2,847 | −18.5% | |
| 2000 | 2,308 | −18.9% | |
| 2010 | 1,990 | −13.8% | |
| Est. 2019 | 1,850 | [9] | −7.0% |
| US Decennial Census[10] 1790-1960[11] 1900-1990[12] 1990-2000[13] 2010-2019[1] | |||
2000 census
As of the 2000 United States Census, there were 2,308 people, 963 households, and 659 families in the county. The population density was 2/sqmi (1/km²). There were 1,193 housing units at an average density of 1.20/sqmi (0.46/km²). The racial makeup of the county was 99.18% White, 0.09% Black or African American, 0.13% Native American, 0.17% Asian, 0.13% from other races, and 0.30% from two or more races. 0.69% of the population were Hispanic or Latino of any race. 75.0% were of German, 7.0% Norwegian and 5.6% American ancestry.
There were 963 households out of which 25.80% had children under the age of 18 living with them, 63.10% were married couples living together, 3.10% had a female householder with no husband present, and 31.50% were non-families. 29.20% of all households were made up of individuals and 16.00% had someone living alone who was 65 years of age or older. The average household size was 2.32 and the average family size was 2.88.
The county population contained 22.60% under the age of 18, 3.60% from 18 to 24, 21.80% from 25 to 44, 25.00% from 45 to 64, and 27.00% who were 65 years of age or older. The median age was 46 years. For every 100 females there were 98.30 males. For every 100 females age 18 and over, there were 95.60 males.
The median income for a household in the county was $27,986, and the median income for a family was $33,125. Males had a median income of $23,750 versus $18,269 for females. The per capita income for the county was $16,947. About 12.60% of families and 15.10% of the population were below the poverty line, including 16.20% of those under age 18 and 18.80% of those age 65 or over.
2010 census
As of the 2010 United States Census, there were 1,990 people, 843 households, and 562 families in the county.[14] The population density was 2.0 inhabitants per square mile (0.77/km2). There were 1,144 housing units at an average density of 1.2 per square mile (0.46/km2).[15] The racial makeup of the county was 98.4% white, 0.5% American Indian, 0.3% Asian, 0.1% black or African American, 0.1% from other races, and 0.7% from two or more races. Those of Hispanic or Latino origin made up 0.6% of the population.[14] In terms of ancestry, 76.0% were German, 16.2% were Russian, 9.9% were Norwegian, and 6.3% were American.[16]
Of the 843 households, 21.8% had children under the age of 18 living with them, 61.4% were married couples living together, 3.0% had a female householder with no husband present, 33.3% were non-families, and 30.8% of all households were made up of individuals. The average household size was 2.28 and the average family size was 2.84. The median age was 49.8 years.[14]
The median income for a household in the county was $41,741 and the median income for a family was $52,262. Males had a median income of $34,451 versus $22,284 for females. The per capita income for the county was $21,654. About 8.3% of families and 10.9% of the population were below the poverty line, including 7.5% of those under age 18 and 18.9% of those age 65 or over.[17]
Communities
Cities
- Fredonia
- Gackle
- Lehr (partly in McIntosh County)
- Napoleon (county seat)
Unorganized territories
- East Logan
- West Logan
Politics
Logan County voters have traditionally voted Republican. In no national election since 1936 has the county selected the Democratic Party candidate.
| Year | Republican | Democratic | Third parties |
|---|---|---|---|
| 2016 | 83.2% 888 | 10.7% 114 | 6.1% 65 |
| 2012 | 75.5% 810 | 21.6% 232 | 2.9% 31 |
| 2008 | 68.7% 726 | 28.3% 299 | 3.0% 32 |
| 2004 | 74.7% 844 | 23.5% 265 | 1.9% 21 |
| 2000 | 70.9% 812 | 19.5% 223 | 9.6% 110 |
| 1996 | 53.1% 705 | 27.1% 360 | 19.8% 263 |
| 1992 | 47.3% 703 | 25.8% 383 | 26.9% 400 |
| 1988 | 66.5% 1,111 | 32.3% 540 | 1.2% 20 |
| 1984 | 72.9% 1,222 | 23.9% 401 | 3.2% 53 |
| 1980 | 79.0% 1,474 | 15.2% 283 | 5.8% 108 |
| 1976 | 50.3% 944 | 43.1% 809 | 6.6% 123 |
| 1972 | 69.3% 1,408 | 27.3% 554 | 3.4% 69 |
| 1968 | 70.5% 1,416 | 22.8% 459 | 6.7% 135 |
| 1964 | 55.4% 1,187 | 44.4% 951 | 0.1% 3 |
| 1960 | 64.1% 1,601 | 35.9% 898 | |
| 1956 | 76.6% 1,807 | 23.2% 547 | 0.2% 4 |
| 1952 | 85.1% 2,165 | 14.5% 369 | 0.4% 10 |
| 1948 | 71.5% 1,585 | 25.1% 557 | 3.4% 76 |
| 1944 | 86.5% 1,904 | 13.4% 294 | 0.2% 4 |
| 1940 | 83.6% 2,572 | 16.2% 498 | 0.2% 7 |
| 1936 | 34.4% 984 | 45.1% 1,292 | 20.5% 588 |
| 1932 | 14.1% 390 | 84.9% 2,350 | 1.0% 27 |
| 1928 | 43.6% 1,013 | 55.7% 1,293 | 0.7% 15 |
| 1924 | 43.3% 787 | 1.6% 29 | 55.1% 1,000 |
| 1920 | 89.7% 1,590 | 8.7% 154 | 1.6% 29 |
| 1916 | 64.1% 567 | 29.4% 260 | 6.5% 57 |
| 1912 | 39.9% 269 | 21.7% 146 | 38.4% 259 |
| 1908 | 81.4% 711 | 16.4% 143 | 2.2% 19 |
| 1904 | 92.8% 454 | 6.3% 31 | 0.8% 4 |
| 1900 | 86.5% 231 | 13.1% 35 | 0.4% 1 |
References
- "State & County QuickFacts". United States Census Bureau. Archived from the original on June 7, 2011. Retrieved November 1, 2013.
- "Find a County". National Association of Counties. Retrieved June 7, 2011.
- Gannett, Henry (1905). The Origin of Certain Place Names in the United States. US Government Printing Office. p. 189.
- "Dakota Territory, South Dakota, and North Dakota: Individual County Chronologies". Dakota Territory Atlas of Historical County Boundaries. The Newberry Library. 2006. Retrieved February 3, 2015.
- "County History". Official Portal for North Dakota State Government. Archived from the original on February 2, 2015. Retrieved May 4, 2011.
- Logan County ND Google Maps (accessed February 23, 2019)
- ""Find an Altitude/Logan County ND" Google Maps (accessed February 23, 2019)". Archived from the original on May 21, 2019. Retrieved February 23, 2019.
- "2010 Census Gazetteer Files". US Census Bureau. August 22, 2012. Archived from the original on January 29, 2015. Retrieved January 28, 2015.
- "Population and Housing Unit Estimates". Retrieved April 6, 2020.
- "US Decennial Census". US Census Bureau. Retrieved January 28, 2015.
- "Historical Census Browser". University of Virginia Library. Retrieved January 28, 2015.
- Forstall, Richard L., ed. (April 20, 1995). "Population of Counties by Decennial Census: 1900 to 1990". US Census Bureau. Retrieved January 28, 2015.
- "Census 2000 PHC-T-4. Ranking Tables for Counties: 1990 and 2000" (PDF). US Census Bureau. April 2, 2001. Retrieved January 28, 2015.
- "Profile of General Population and Housing Characteristics: 2010 Demographic Profile Data". US Census Bureau. Archived from the original on February 13, 2020. Retrieved March 14, 2016.
- "Population, Housing Units, Area, and Density: 2010 - County". US Census Bureau. Archived from the original on February 13, 2020. Retrieved March 14, 2016.
- "Selected Social Characteristics in the US – 2006-2010 American Community Survey 5-Year Estimates". US Census Bureau. Archived from the original on February 13, 2020. Retrieved March 14, 2016.
- "Selected Economic Characteristics – 2006-2010 American Community Survey 5-Year Estimates". US Census Bureau. Archived from the original on February 13, 2020. Retrieved March 14, 2016.
- Merged with West Logan UT
- "1990 Census of Population and Housing: North Dakota" (PDF). US Census Bureau. 1992. p. III-2. Retrieved September 11, 2008.
- Leip, David. "Atlas of US Presidential Elections". uselectionatlas.org. Retrieved April 12, 2018.
External links
- Logan County map, North Dakota DOT
Places adjacent to Logan County, North Dakota | ||||||||||
|---|---|---|---|---|---|---|---|---|---|---|
| ||||||||||
Municipalities and communities of Logan County, North Dakota, United States | ||
|---|---|---|
| Cities | Map of North Dakota highlighting Logan County | |
| Townships | ||
| Former townships | ||
| Unorganized territories |
| |
| Unincorporated communities |
| |
| Footnotes | ‡This populated place also has portions in an adjacent county or counties | |

| Authority control |
|
|---|