Bottineau County, North Dakota
Bottineau County is a county in the U.S. state of North Dakota. As of the 2010 census, the population was 6,579.[1] Its county seat is Bottineau.[2]
Bottineau County | |
|---|---|
 | |
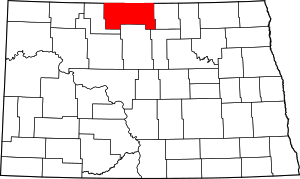 Location within the U.S. state of North Dakota | |
 North Dakota's location within the U.S. | |
| Coordinates: 48°47′N 100°50′W | |
| Country | |
| State | |
| Founded | January 4, 1873 (created) July 17, 1884 (organized) |
| Named for | Pierre Bottineau |
| Seat | Bottineau |
| Largest city | Bottineau |
| Area | |
| • Total | 1,697 sq mi (4,400 km2) |
| • Land | 1,668 sq mi (4,320 km2) |
| • Water | 29 sq mi (80 km2) 1.7% |
| Population (2010) | |
| • Total | 6,579 |
| • Estimate (2019) | 6,282 |
| • Density | 3.9/sq mi (1.5/km2) |
| Time zone | UTC−6 (Central) |
| • Summer (DST) | UTC−5 (CDT) |
| Congressional district | At-large |
| Website | botco |
The Territorial legislature identified Bottineau as one of the original counties of the territory. on January 4, 1873. Its organization was effected on July 17, 1884.[3] It is named for Pierre Bottineau (c.1814-1895), a Métis pioneer, hunter, and trapper who became a successful land speculator.[4]
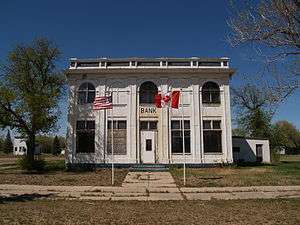
Bottineau is well known for its winter park, snowmobiling, and ice fishing. It is south from the Canadian borders of Manitoba and Saskatchewan.
Geography
Bottineau County lies on the north side of North Dakota. Its north boundary line abuts the south boundary line of Canada. The Deep River flows south-southeastward through the center part of the county. The county terrain consists of rolling hills, dotted with lakes and ponds.[5] The terrain slopes to the south, with its highest point on its upper east boundary line, at 2,283' (696m) ASL.[6] The county has a total area of 1,697 square miles (4,400 km2), of which 1,668 square miles (4,320 km2) is land and 29 square miles (75 km2) (1.7%) is water.[7]
Part of the Turtle Mountain plateau lies in the northeastern corner of the county.
Adjacent counties and rural municipalities
- Argyle No. 1, Saskatchewan - north
- Municipality of Two Borders, Manitoba - north
- Municipality of Brenda-Waskada, Manitoba - north
- Municipality of Deloraine-Winchester, Manitoba - north
- Municipality of Boissevain-Morton, Manitoba - north
- Rolette County - east
- Pierce County - southeast
- McHenry County - south
- Renville County - west
Major highways
Protected areas[5]
- J. Clark Salyer National Wildlife Refuge (part)
- Lake Metigoshe State Park
- Lords Lake National Wildlife Refuge (part)
- North Dakota State Forest Service Land
Lakes[5]
- Black Lake
- Boundary Lake
- Grass Lake
- Island Lake
- Long Lake
- Loon Lake
- Lords Lake
- Pelican Lake
- Strawberry Lake
Demographics
| Historical population | |||
|---|---|---|---|
| Census | Pop. | %± | |
| 1890 | 2,893 | — | |
| 1900 | 7,532 | 160.4% | |
| 1910 | 17,295 | 129.6% | |
| 1920 | 15,109 | −12.6% | |
| 1930 | 14,853 | −1.7% | |
| 1940 | 13,253 | −10.8% | |
| 1950 | 12,140 | −8.4% | |
| 1960 | 11,315 | −6.8% | |
| 1970 | 9,496 | −16.1% | |
| 1980 | 9,239 | −2.7% | |
| 1990 | 8,011 | −13.3% | |
| 2000 | 7,149 | −10.8% | |
| 2010 | 6,429 | −10.1% | |
| Est. 2019 | 6,282 | [8] | −2.3% |
| US Decennial Census[9] 1790-1960[10] 1900-1990[11] 1990-2000[12] 2010-2019[1] | |||
2000 census
As of the 2000 United States Census, there were 7,149 people, 2,962 households, and 1,954 families in the county. The population density was 4 people per square mile (2/km²). There were 4,409 housing units at an average density of 3 per square mile (1/km²). The racial makeup of the county was 97.22% White, 0.22% Black or African American, 1.45% Native American, 0.18% Asian, 0.01% Pacific Islander, 0.11% from other races, and 0.80% from two or more races. 0.49% of the population were Hispanic or Latino of any race. 44.4% were of Norwegian, 25.2% German and 5.4% French ancestry.
There were 2,962 households out of which 27.30% had children under the age of 18 living with them, 58.70% were married couples living together, 4.30% had a female householder with no husband present, and 34.00% were non-families. 31.50% of all households were made up of individuals and 16.40% had someone living alone who was 65 years of age or older. The average household size was 2.30 and the average family size was 2.90.
The county population contained 22.20% under the age of 18, 8.00% from 18 to 24, 22.30% from 25 to 44, 26.20% from 45 to 64, and 21.30% who were 65 years of age or older. The median age was 43 years. For every 100 females there were 101.40 males. For every 100 females age 18 and over, there were 99.20 males.
The median income for a household in the county was $29,853, and the median income for a family was $37,701. Males had a median income of $26,728 versus $18,948 for females. The per capita income for the county was $16,227. About 7.50% of families and 10.70% of the population were below the poverty line, including 11.70% of those under age 18 and 11.10% of those age 65 or over.
2010 census
As of the 2010 United States Census, there were 6,429 people, 2,832 households, and 1,823 families in the county.[13] The population density was 3.9 inhabitants per square mile (1.5/km2). There were 4,341 housing units at an average density of 2.6 per square mile (1.0/km2).[14] The racial makeup of the county was 95.1% white, 2.1% American Indian, 0.4% black or African American, 0.2% Asian, 0.3% from other races, and 1.8% from two or more races. Those of Hispanic or Latino origin made up 1.3% of the population.[13] In terms of ancestry, 47.0% were Norwegian, 37.4% were German, 7.7% were Irish, 6.2% were Swedish, and 1.4% were American.[15]
Of the 2,832 households, 22.8% had children under the age of 18 living with them, 55.3% were married couples living together, 5.6% had a female householder with no husband present, 35.6% were non-families, and 32.2% of all households were made up of individuals. The average household size was 2.17 and the average family size was 2.72. The median age was 48.0 years.[13]
The median income for a household in the county was $40,227 and the median income for a family was $60,714. Males had a median income of $42,227 versus $27,500 for females. The per capita income for the county was $26,277. About 9.5% of families and 13.6% of the population were below the poverty line, including 16.5% of those under age 18 and 13.4% of those age 65 or over.[16]
Communities
Cities
Unincorporated communities[5]
Townships
- Amity
- Antler
- Bentinck
- Blaine
- Brander
- Cecil
- Chatfield
- Cordelia
- Cut Bank
- Dalen
- Eidsvold
- Elms
- Elysian
- Haram
- Hastings
- Hoffman
- Homen
- Kane
- Lansford
- Lewis
- Lordsburg
- Mount Rose
- Newborg
- Oak Creek
- Oak Valley
- Ostby
- Peabody
- Pickering
- Renville
- Richburg
- Roland
- Scandia
- Scotia
- Sergius
- Sherman
- Starbuck
- Stone Creek
- Tacoma
- Wayne
- Wellington
- Wheaton
- Whitby
- Whitteron
- Willow Vale
Politics
Bottineau County voters have been reliably Republican for decades. In no national election since 1964 has the county selecdted the Democratic Party candidate.
| Year | Republican | Democratic | Third parties |
|---|---|---|---|
| 2016 | 71.4% 2,494 | 21.1% 736 | 7.6% 264 |
| 2012 | 64.1% 2,280 | 33.3% 1,183 | 2.6% 92 |
| 2008 | 58.6% 2,059 | 39.5% 1,387 | 2.0% 70 |
| 2004 | 67.2% 2,468 | 31.8% 1,168 | 1.0% 38 |
| 2000 | 63.7% 2,349 | 31.8% 1,173 | 4.6% 168 |
| 1996 | 47.8% 1,682 | 36.4% 1,280 | 15.8% 557 |
| 1992 | 43.5% 1,787 | 30.9% 1,266 | 25.6% 1,051 |
| 1988 | 59.5% 2,530 | 39.6% 1,684 | 0.9% 37 |
| 1984 | 71.6% 3,356 | 27.3% 1,279 | 1.1% 53 |
| 1980 | 70.3% 3,394 | 22.6% 1,090 | 7.1% 344 |
| 1976 | 56.1% 2,638 | 42.3% 1,987 | 1.6% 75 |
| 1972 | 69.6% 3,263 | 29.2% 1,369 | 1.2% 56 |
| 1968 | 60.1% 2,633 | 34.7% 1,520 | 5.3% 231 |
| 1964 | 44.7% 2,060 | 55.3% 2,546 | 0.0% 1 |
| 1960 | 61.0% 3,092 | 38.9% 1,974 | 0.1% 3 |
| 1956 | 62.9% 2,923 | 37.0% 1,718 | 0.1% 5 |
| 1952 | 77.7% 3,911 | 21.7% 1,094 | 0.6% 29 |
| 1948 | 59.4% 2,513 | 37.1% 1,571 | 3.5% 147 |
| 1944 | 57.2% 2,663 | 41.9% 1,953 | 0.9% 44 |
| 1940 | 55.6% 3,129 | 43.9% 2,469 | 0.5% 30 |
| 1936 | 21.2% 1,224 | 56.9% 3,286 | 22.0% 1,269 |
| 1932 | 21.6% 1,201 | 75.1% 4,178 | 3.4% 188 |
| 1928 | 49.8% 2,680 | 49.2% 2,648 | 1.0% 55 |
| 1924 | 32.0% 1,338 | 5.3% 221 | 62.7% 2,623 |
| 1920 | 72.5% 3,487 | 20.2% 970 | 7.3% 351 |
| 1916 | 41.3% 1,294 | 47.0% 1,471 | 11.7% 365 |
| 1912 | 26.9% 700 | 31.8% 825 | 41.3% 1,073 |
| 1908 | 59.5% 1,951 | 34.9% 1,146 | 5.6% 185 |
| 1904 | 68.5% 2,094 | 24.6% 753 | 6.9% 211 |
| 1900 | 52.3% 728 | 45.1% 628 | 2.6% 36 |
References
- "State & County QuickFacts". United States Census Bureau. Retrieved October 31, 2013.
- "Find a County". National Association of Counties. Archived from the original on May 31, 2011. Retrieved June 7, 2011.
- "Dakota Territory, South Dakota, and North Dakota: Individual County Chronologies". Dakota Territory Atlas of Historical County Boundaries. The Newberry Library. 2006. Retrieved February 2, 2015.
- "County History". Official Portal for North Dakota State Government. Archived from the original on February 2, 2015. Retrieved May 4, 2011.
- Bottineau County ND Google Maps (accessed 14 February 2019)
- ""Find an Altitude/Bottineau County ND" Google Maps (accessed 14 February 2019)". Archived from the original on May 21, 2019. Retrieved February 15, 2019.
- "2010 Census Gazetteer Files". US Census Bureau. August 22, 2012. Archived from the original on January 29, 2015. Retrieved January 27, 2015.
- "Population and Housing Unit Estimates". Retrieved April 2, 2020.
- "US Decennial Census". US Census Bureau. Retrieved January 27, 2015.
- "Historical Census Browser". University of Virginia Library. Retrieved January 27, 2015.
- Forstall, Richard L., ed. (March 27, 1995). "Population of Counties by Decennial Census: 1900 to 1990". US Census Bureau. Retrieved January 27, 2015.
- "Census 2000 PHC-T-4. Ranking Tables for Counties: 1990 and 2000" (PDF). US Census Bureau. April 2, 2001. Retrieved January 27, 2015.
- "Profile of General Population and Housing Characteristics: 2010 Demographic Profile Data". US Census Bureau. Archived from the original on February 13, 2020. Retrieved March 14, 2016.
- "Population, Housing Units, Area, and Density: 2010 - County". US Census Bureau. Archived from the original on February 13, 2020. Retrieved March 14, 2016.
- "Selected Social Characteristics in the US – 2006-2010 American Community Survey 5-Year Estimates". US Census Bureau. Archived from the original on February 13, 2020. Retrieved March 14, 2016.
- "Selected Economic Characteristics – 2006-2010 American Community Survey 5-Year Estimates". US Census Bureau. Archived from the original on February 13, 2020. Retrieved March 14, 2016.
- Leip, David. "Atlas of US Presidential Elections". uselectionatlas.org. Retrieved April 12, 2018.
External links
- Bottineau County diamond jubilee, 1884-1959 : Bottineau, North Dakota, June 28-29-30-July 1, 1959 from the Digital Horizons website
- Bottineau County opportunities : North Dakota - the sunshine state (1916) from the Digital Horizons website
- Bottineau County maps, Sheet 1 (eastern) and Sheet 2 (western), North Dakota DOT
Places adjacent to Bottineau County, North Dakota | ||||||||||
|---|---|---|---|---|---|---|---|---|---|---|
| ||||||||||
Municipalities and communities of Bottineau County, North Dakota, United States | ||
|---|---|---|
| Cities | Map of North Dakota highlighting Bottineau County | |
| Townships |
| |
| Unincorporated communities | ||

| Authority control |
|
|---|