Grand Forks County, North Dakota
Grand Forks County is a county in the U.S. state of North Dakota. As of the 2010 United States Census, its population was 66,861,[1] making it the third-most populous county in North Dakota. Its county seat and largest community is Grand Forks.[2]
Grand Forks County | |
|---|---|
 | |
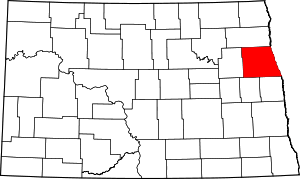 Location within the U.S. state of North Dakota | |
 North Dakota's location within the U.S. | |
| Coordinates: 47°55′N 97°27′W | |
| Country | |
| State | |
| Founded | January 4, 1873 (created) March 2, 1875 (organized) |
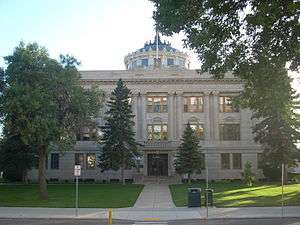
| Seat | Grand Forks |
| Largest city | Grand Forks |
| Area | |
| • Total | 1,440 sq mi (3,700 km2) |
| • Land | 1,436 sq mi (3,720 km2) |
| • Water | 3.1 sq mi (8 km2) 0.2% |
| Population (2010) | |
| • Total | 66,861 |
| • Estimate (2019) | 69,451 |
| • Density | 46/sq mi (18/km2) |
| Time zone | UTC−6 (Central) |
| • Summer (DST) | UTC−5 (CDT) |
| Congressional district | At-large |
| Website | www |
History
Using territory annexed from Pembina County, the Dakota Territory legislature created Grand Forks County on January 4, 1873. Its governing structure was not established at that time, nor was the territory attached to another county for administrative and judicial purposes. The government was organized on March 2, 1875.
The county's boundaries were altered in 1875, 1881, and 1883. It has retained its present boundary since 1883.[3][4]
Grand Forks County is included in the Grand Forks, ND-MN Metropolitan Statistical Area.
Geography
Grand Forks County lies on the east side of North Dakota. Its east boundary line abuts the west boundary line of the state of Minnesota (across the Red River). The Red River flows northward along the county's east border, on its way to Lake Winnipeg and Hudson Bay. The Forest River flows easterly and northerly across the upper western part of the county.
The terrain of Grand Forks County consists of low rolling hills, devoted to agriculture except around urban areas.[5] The terrain slopes to the north and east; its highest point is a hill at its SW corner, at 1,450' (457m) ASL.[6] The county has a total area of 1,440 square miles (3,700 km2), of which 1,436 square miles (3,720 km2) is land and 3.1 square miles (8.0 km2) (0.2%) is water.[7]
The University of North Dakota has established a Field Biology Station on Forest River, at the county's north border. In 2013 it partnered with ND Game & Fish Department to establish a 160-acre (0.65 km²) wildlife management area at the station, to monitor whitetail deer activity in the forest.[8] The field station is tasked with identifying plants native and endemic to the area. 498 plants have been collected at the Forest River Biology Station and Wildlife Management Area.[9]
Major highways
Adjacent counties
- Walsh County - north
- Marshall County, Minnesota - northeast
- Polk County, Minnesota - east
- Traill County - southeast
- Steele County - southwest
- Nelson County - west
Protected areas[5]
- Forest River Biology Station/Wildlife Management Area
- Grand Forks County Laarimer Dam Recreation Area
- Kellys Slough National Wildlife Refuge
- Little Goose National Wildlife Refuge
- Prairie Chicken State Game Management Area
- Turtle River State Park
Lakes[5]
- Fordville Dam
- Larimore Dam
- Smith Lakes
Demographics
| Historical population | |||
|---|---|---|---|
| Census | Pop. | %± | |
| 1880 | 6,248 | — | |
| 1890 | 18,357 | 193.8% | |
| 1900 | 24,459 | 33.2% | |
| 1910 | 27,888 | 14.0% | |
| 1920 | 28,795 | 3.3% | |
| 1930 | 31,956 | 11.0% | |
| 1940 | 34,518 | 8.0% | |
| 1950 | 39,448 | 14.3% | |
| 1960 | 48,677 | 23.4% | |
| 1970 | 61,102 | 25.5% | |
| 1980 | 66,100 | 8.2% | |
| 1990 | 70,683 | 6.9% | |
| 2000 | 66,109 | −6.5% | |
| 2010 | 66,861 | 1.1% | |
| Est. 2019 | 69,451 | [10] | 3.9% |
| US Decennial Census[11] 1790-1960[12] 1900-1990[13] 1990-2000[14] 2010-2019[1] | |||
2000 census
As of the 2000 United States Census, there were 66,109 people, 25,435 households, and 15,617 families in the county. The population density was 46 people per square mile (18/km²). There were 27,373 housing units at an average density of 19 per square mile (7/km²). The racial makeup of the county was 93.00% White, 1.37% Black or African American, 2.31% Native American, 0.98% Asian, 0.07% Pacific Islander, 0.72% from other races, and 1.57% from two or more races. 2.06% of the population were Hispanic or Latino of any race. 31.6% were of Norwegian, 26.1% German and 5.5% Irish ancestry.
There were 25,435 households out of which 32.4% had children under the age of 18 living with them, 49.5% were married couples living together, 8.8% had a female householder with no husband present, and 38.6% were non-families. 28.3% of all households were made up of individuals and 8.2% had someone living alone who was 65 years of age or older. The average household size was 2.43 and the average family size was 3.03.
The county population contained 23.8% under the age of 18, 19.6% from 18 to 24, 28.8% from 25 to 44, 18.2% from 45 to 64, and 9.6% who were 65 years of age or older. The median age was 29 years. For every 100 females, there were 103.7 males. For every 100 females age 18 and over, there were 102.3 males.
The median income for a household in the county was $35,785, and the median income for a family was $46,620. Males had a median income of $30,079 versus $21,426 for females. The per capita income for the county was $17,868. About 8.0% of families and 12.3% of the population were below the poverty line, including 12.0% of those under age 18 and 7.6% of those age 65 or over.
2010 census
As of the 2010 census, there were 66,861 people, 27,417 households, and 15,215 families in the county.[15] The population density was 46.5 inhabitants per square mile (18.0/km2). There were 29,344 housing units at an average density of 20.4 per square mile (7.9/km2).[16] The racial makeup of the county was 90.3% white, 2.5% American Indian, 2.0% black or African American, 1.9% Asian, 0.1% Pacific islander, 0.8% from other races, and 2.4% from two or more races. Those of Hispanic or Latino origin made up 2.9% of the population.[15] In terms of ancestry, 34.1% were German, 33.8% were Norwegian, 9.5% were Irish, 5.8% were Polish, 5.3% were English, and 2.9% were American.[17]
Of the 27,417 households, 26.6% had children under the age of 18 living with them, 42.8% were married couples living together, 9.1% had a female householder with no husband present, 44.5% were non-families, and 32.1% of all households were made up of individuals. The average household size was 2.28 and the average family size was 2.91. The median age was 29.7 years.[15]
The median income for a household in the county was $44,242 and the median income for a family was $65,804. Males had a median income of $40,622 versus $31,633 for females. The per capita income for the county was $24,276. About 8.2% of families and 17.5% of the population were below the poverty line, including 15.6% of those under age 18 and 10.3% of those age 65 or over.[18]
Population by decade

Communities
Cities
Census-designated places
Other communities[5]
- Arvilla
- Belleville
- Emerado
- Forest River Colony
- Hannah Junction
- Johnstown
- Kempton
- Logan Center
- McCanna
- Mekinock
Townships
- Agnes
- Allendale
- Americus
- Arvilla
- Avon
- Bentru
- Blooming
- Brenna
- Chester
- Elkmount
- Elm Grove
- Fairfield
- Falconer
- Ferry
- Gilby
- Grace
- Grand Forks
- Hegton
- Inkster
- Johnstown
- Lakeville
- Larimore
- Levant
- Lind
- Logan Center
- Loretta
- Mekinock
- Michigan
- Moraine
- Niagara
- Northwood
- Oakville
- Pleasant View
- Plymouth
- Rye
- Strabane
- Turtle River
- Union
- Walle
- Washington
- Wheatfield
| Range 56 | Range 55 | Range 54 | Range 53 | Range 52 | Range 51 | Range 50 | Range 49 | |
|---|---|---|---|---|---|---|---|---|
| Township 154 | Elkmount | Inkster | Strabane | Johnstown | Levant | Turtle River | Turte River | |
| Township 153 | Plymouth | Agnes | Wheatfield | Gilby | Lakeville | Ferry | Ferry | |
| Township 152 | Niagara | Elm Grove | Hegton | Mekinock | Blooming | Rye | Falconer | |
| Township 151 | Moraine | Larimore | Arvilla | Chester | Oakville | Brenna | Grand Forks | |
| Township 150 | Logan Center | Grace | Avon | Pleasant View | Fairfield | Allendale | Walle | Walle |
| Township 149 | Loretta | Lind | Northwood | Washington | Union | Micbigan | Americus | Bentru |
Politics
Grand Forks County voters historically vote Republican. In only one national election since 1964 has the county selected the Democratic Party candidate.
| Year | Republican | Democratic | Third parties |
|---|---|---|---|
| 2016 | 53.8% 16,340 | 35.7% 10,851 | 10.5% 3,174 |
| 2012 | 50.2% 15,060 | 46.7% 14,032 | 3.1% 937 |
| 2008 | 46.3% 14,520 | 51.4% 16,104 | 2.3% 709 |
| 2004 | 56.8% 17,298 | 41.5% 12,646 | 1.7% 526 |
| 2000 | 55.9% 15,875 | 37.3% 10,593 | 6.8% 1,917 |
| 1996 | 44.9% 11,606 | 44.0% 11,376 | 11.1% 2,854 |
| 1992 | 44.1% 13,705 | 35.1% 10,930 | 20.8% 6,469 |
| 1988 | 53.8% 14,801 | 45.4% 12,494 | 0.9% 236 |
| 1984 | 60.7% 15,898 | 38.4% 10,050 | 0.9% 243 |
| 1980 | 57.7% 14,257 | 28.3% 6,997 | 14.1% 3,477 |
| 1976 | 52.7% 13,820 | 44.0% 11,545 | 3.3% 853 |
| 1972 | 56.9% 13,361 | 40.1% 9,416 | 3.0% 698 |
| 1968 | 52.0% 9,802 | 40.8% 7,695 | 7.2% 1,352 |
| 1964 | 40.5% 7,367 | 59.1% 10,740 | 0.4% 68 |
| 1960 | 56.9% 10,997 | 43.1% 8,341 | 0.0% 5 |
| 1956 | 62.2% 10,289 | 37.7% 6,231 | 0.2% 30 |
| 1952 | 65.7% 10,939 | 33.8% 5,639 | 0.5% 84 |
| 1948 | 46.2% 6,374 | 50.7% 6,996 | 3.0% 419 |
| 1944 | 42.2% 5,668 | 57.4% 7,707 | 0.4% 59 |
| 1940 | 45.4% 7,043 | 54.2% 8,396 | 0.4% 67 |
| 1936 | 29.6% 4,312 | 63.4% 9,222 | 7.0% 1,015 |
| 1932 | 39.5% 5,090 | 58.8% 7,579 | 1.8% 231 |
| 1928 | 64.9% 8,024 | 34.8% 4,300 | 0.4% 47 |
| 1924 | 62.8% 6,690 | 8.9% 943 | 28.3% 3,018 |
| 1920 | 74.0% 7,646 | 24.5% 2,527 | 1.5% 159 |
| 1916 | 41.9% 2,159 | 54.7% 2,814 | 3.4% 175 |
| 1912 | 23.9% 955 | 37.3% 1,492 | 38.8% 1,552[21] |
| 1908 | 57.4% 2,740 | 36.7% 1,750 | 5.9% 283 |
| 1904 | 73.2% 2,807 | 21.6% 828 | 5.3% 202 |
| 1900 | 61.3% 2,603 | 36.1% 1,532 | 2.6% 109 |
References
- "State & County QuickFacts". United States Census Bureau. Archived from the original on June 7, 2011. Retrieved October 31, 2013.
- "Find a County". National Association of Counties. Archived from the original on May 31, 2011. Retrieved June 7, 2011.
- "Dakota Territory, South Dakota, and North Dakota: Individual County Chronologies". Dakota Territory Atlas of Historical County Boundaries. The Newberry Library. 2006. Retrieved February 3, 2015.
- "County History". North Dakota.gov. The State of North Dakota. Archived from the original on February 2, 2015. Retrieved February 3, 2015.
- Grand Forks County ND Google Maps (accessed February 19, 2019)
- ""Find an Altitude/Grand Forks County ND" Google Maps (accessed 19 February 2019)". Archived from the original on May 21, 2019. Retrieved February 19, 2019.
- "2010 Census Gazetteer Files". US Census Bureau. August 22, 2012. Archived from the original on January 29, 2015. Retrieved January 28, 2015.
- "Grand Forks Herald" (22 June 2017)
- The checklist of vascular plants of Forest River Biology Station and Wildlife Management Area, Grand Forks county, North Dakota
- "Population and Housing Unit Estimates". Retrieved March 26, 2020.
- "US Decennial Census". US Census Bureau. Retrieved January 28, 2015.
- "Historical Census Browser". University of Virginia Library. Retrieved January 28, 2015.
- Forstall, Richard L., ed. (March 27, 1995). "Population of Counties by Decennial Census: 1900 to 1990". US Census Bureau. Retrieved January 28, 2015.
- "Census 2000 PHC-T-4. Ranking Tables for Counties: 1990 and 2000" (PDF). US Census Bureau. April 2, 2001. Retrieved January 28, 2015.
- "Profile of General Population and Housing Characteristics: 2010 Demographic Profile Data". US Census Bureau. Archived from the original on February 13, 2020. Retrieved March 14, 2016.
- "Population, Housing Units, Area, and Density: 2010 - County". US Census Bureau. Archived from the original on February 13, 2020. Retrieved March 14, 2016.
- "Selected Social Characteristics in the US – 2006-2010 American Community Survey 5-Year Estimates". US Census Bureau. Archived from the original on February 13, 2020. Retrieved March 14, 2016.
- "Selected Economic Characteristics – 2006-2010 American Community Survey 5-Year Estimates". US Census Bureau. Archived from the original on February 13, 2020. Retrieved March 14, 2016.
- "Earth Point".
- Leip, David. "Atlas of US Presidential Elections". uselectionatlas.org. Retrieved April 12, 2018.
- The leading "other" candidate, Progressive Theodore Roosevelt, received 1,327 votes, while Socialist candidate Eugene Debs received 180 votes, Prohibition candidate Eugene Chafin received 45 votes.
External links
Places adjacent to Grand Forks County, North Dakota | ||||||||||
|---|---|---|---|---|---|---|---|---|---|---|
| ||||||||||
Municipalities and communities of Grand Forks County, North Dakota, United States | ||
|---|---|---|
| Cities | Map of North Dakota highlighting Grand Forks County | |
| Townships |
| |
| CDP | ||
| Unincorporated communities |
| |
| Ghost town |
| |
| Footnotes | ‡This populated place also has portions in an adjacent county or counties | |
| Counties | ||
|---|---|---|
| Main cities | ||
| Surrounding areas | ||
† - county seat | ||

| Authority control |
|
|---|