Mountrail County, North Dakota
Mountrail County is a county in the northwestern part of North Dakota, United States. As of the 2010 United States Census, the population was 7,673.[1] Its county seat is Stanley.[2] The county was originally created in 1873, then removed in 1892, annexed by Ward County. It was re-created and organized in 1909.[3][4]
Mountrail County | |
|---|---|
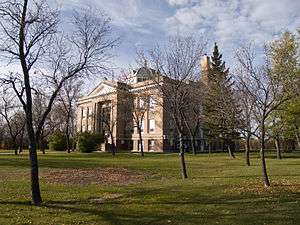 Mountrail County Courthouse in Stanley | |
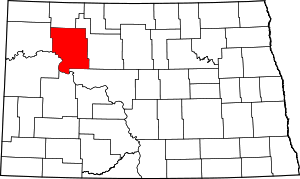 Location within the U.S. state of North Dakota | |
 North Dakota's location within the U.S. | |
| Coordinates: 48°12′N 102°22′W | |
| Country | |
| State | |
| Founded | January 4, 1873 1892 (eliminated) January 29, 1909 (reestablished) |
| Seat | Stanley |
| Largest city | Stanley |
| Area | |
| • Total | 1,942 sq mi (5,030 km2) |
| • Land | 1,825 sq mi (4,730 km2) |
| • Water | 116 sq mi (300 km2) 6.0% |
| Population (2010) | |
| • Total | 7,673 |
| • Estimate (2019) | 10,545 |
| • Density | 4.0/sq mi (1.5/km2) |
| Time zone | UTC−6 (Central) |
| • Summer (DST) | UTC−5 (CDT) |
| Congressional district | At-large |
| Website | www |
Oil production from the Bakken formation in the early 21st century has attracted workers and reversed decades of population decline in the county. From 2010 to 2015, especially, population has markedly increased, creating its own strains.
History
The Dakota Territory legislature created the county (as Mountraille County) on January 4, 1873, with area annexed from Buffalo County. It was not organized at that time, nor was it attached to another county for administrative or judicial purposes. The new county lost territory in 1885 when a portion was annexed off to create Garfield County (now extinct). This situation continued until February 21, 1891, when Mountrail County was attached to Ward County, for "judicial and other purposes". The following year (November 8, 1892), the North Dakota legislature voted to dissolve the county and have its territory absorbed by Ward County.
The election held in Ward County on November 3, 1908 authorized the re-creation of Mountrail County, although with different boundaries than the previous county proposal. The countywide vote totals were 4207 to 4024, but it was contested in court. On January 16, 1909 the state Supreme Court upheld the vote, so the county government was organized on January 29 of that year.[4][5][6]
Geography
The Missouri River flows southeastward along the SW boundary line of Mountrail County, and Shell Creek drains the lower central part of the county into the Missouri, discharging at Shell Creek Bay. The terrain consists of rolling hills, largely devoted to agriculture. Its NE portion is dotted with ponds and lakes.[7] The Laurentian Divide runs east-west through the central part of the county, with the northern areas sloping to the north and the southern areas sloping to the south. Its highest point is on the upper west boundary line, at 2,480' (756m) ASL.[8] The county has a total area of 1,942 square miles (5,030 km2), of which 1,825 square miles (4,730 km2) is land and 116 square miles (300 km2) (6.0%) is water.[9]
Mountrail County is one of several western North Dakota counties with significant exposure to the Bakken Formation in the Williston Basin.
Major highways
Adjacent counties
- Burke County - north
- Ward County - east
- McLean County - southeast
- Dunn County - south
- McKenzie County - southwest
- Williams County - west
Protected areas[7]
- Crow Flies High Butte
- Lostwood National Wildlife Refuge (part)
- Palermo State Game Management Area
- Reunion Point Public Use Area
- Shell Lake National Wildlife Refuge
- Van Hook State Game Management Area
- Van Hook State Wildlife Management Area
Lakes[7]
- Cottonwood Lake
- Lake Sakakawea
- Powers Lake (part)
- Rat Lake
- Robinson Lake
- Shell Lake
- Van Hook Arm
- White Lake
Demographics
| Historical population | |||
|---|---|---|---|
| Census | Pop. | %± | |
| 1910 | 8,491 | — | |
| 1920 | 12,140 | 43.0% | |
| 1930 | 13,544 | 11.6% | |
| 1940 | 10,482 | −22.6% | |
| 1950 | 9,418 | −10.2% | |
| 1960 | 10,077 | 7.0% | |
| 1970 | 8,437 | −16.3% | |
| 1980 | 7,679 | −9.0% | |
| 1990 | 7,021 | −8.6% | |
| 2000 | 6,631 | −5.6% | |
| 2010 | 7,673 | 15.7% | |
| Est. 2019 | 10,545 | [10] | 37.4% |
| US Decennial Census[11] 1790-1960[12] 1900-1990[13] 1990-2000[14] 2010-2019[1] | |||
2000 census
As of the 2000 United States Census, there were 6,631 people, 2,560 households, and 1,753 families in the county. The population density was 3.63/sqmi (1.40/km²). There were 3,438 housing units at an average density of 1.88/sqmi (0.73/km²). The racial makeup of the county was 65.99% White, 0.09% Black or African American, 29.98% Native American, 0.21% Asian, 0.05% Pacific Islander, 0.26% from other races, and 3.42% from two or more races. 1.31% of the population were Hispanic or Latino of any race. 37.1% were of Norwegian and 15.4% German ancestry.
There were 2,560 households out of which 31.80% had children under the age of 18 living with them, 51.80% were married couples living together, 11.80% had a female householder with no husband present, and 31.50% were non-families. 28.50% of all households were made up of individuals and 14.60% had someone living alone who was 65 years of age or older. The average household size was 2.53 and the average family size was 3.09.
The county population contained 28.10% under the age of 18, 6.80% from 18 to 24, 23.20% from 25 to 44, 24.20% from 45 to 64, and 17.70% who were 65 years of age or older. The median age was 40 years. For every 100 females there were 96.80 males. For every 100 females age 18 and over, there were 95.10 males.
The median income for a household in the county was $27,098, and the median income for a family was $31,864. Males had a median income of $24,750 versus $20,844 for females. The per capita income for the county was $13,422. About 14.00% of families and 19.30% of the population were below the poverty line, including 23.40% of those under age 18 and 18.30% of those age 65 or over.
2010 census
As of the 2010 census, there were 7,673 people, 2,793 households, and 1,852 families in the county.[15] The population density was 4.20/sqmi (1.62/km²). There were 4,119 housing units at an average density of 2.26/sqmi (0.87/km²).[16] The racial makeup of the county was 65.6% white, 30.6% American Indian, 0.2% black or African American, 0.2% Asian, 0.8% from other races, and 2.6% from two or more races. Those of Hispanic or Latino origin made up 3.7% of the population.[15] In terms of ancestry, 36.6% were Norwegian, 24.4% were German, 6.6% were Irish, and 0.8% were American.[17]
Of the 2,793 households, 31.1% had children under the age of 18 living with them, 48.3% were married couples living together, 11.4% had a female householder with no husband present, 33.7% were non-families, and 28.3% of all households were made up of individuals. The average household size was 2.55 and the average family size was 3.11. The median age was 37.0 years.[15]
The median income for a household in the county was $53,912 and the median income for a family was $63,238. Males had a median income of $43,386 versus $29,432 for females. The per capita income for the county was $25,762. About 13.5% of families and 16.5% of the population were below the poverty line, including 24.2% of those under age 18 and 14.2% of those age 65 or over.[18]
Mountrail County Website
http://www.co.mountrail.nd.us/
http://www.co.mountrail.nd.us/pages/gis - Mountrail County GIS Page
Communities
Unincorporated communities[7]
Townships
- Alger
- Austin
- Banner
- Bicker
- Big Bend
- Brookbank
- Burke
- Clearwater
- Cottonwood
- Crane Creek
- Crowfoot
- Debing
- Egan
- Fertile
- Howie
- Idaho
- James Hill
- Kickapoo
- Knife River
- Liberty
- Lostwood
- Lowland
- Manitou
- McAlmond
- McGahan
- Model
- Mountrail
- Myrtle
- Oakland
- Osborn
- Osloe
- Palermo
- Parshall
- Plaza
- Powers
- Powers Lake
- Purcell
- Rat Lake
- Redmond
- Ross
- Shell
- Sidonia
- Sikes
- Sorkness
- Spring Coulee
- Stave
- Van Hook
- Wayzetta
- White Earth
Politics
Mountrail County is a swing county. Bill Clinton won both of his terms, and Barack Obama carried this county in the 2008 election. However, he wasn't able to carry this county in 2012, falling to Republican Mitt Romney by over 16%. Hillary Clinton received the smallest vote by a Democratic candidate (29.7%) since Progressive Party candidate Robert La Follette received an overwhelming vote in 1924.
| Year | Republican | Democratic | Third parties |
|---|---|---|---|
| 2016 | 62.9% 2,582 | 29.7% 1,220 | 7.4% 304 |
| 2012 | 56.8% 1,962 | 40.6% 1,403 | 2.7% 92 |
| 2008 | 47.9% 1,406 | 50.3% 1,477 | 1.9% 55 |
| 2004 | 50.4% 1,527 | 48.4% 1,465 | 1.3% 38 |
| 2000 | 50.6% 1,466 | 43.4% 1,256 | 6.0% 174 |
| 1996 | 36.9% 965 | 48.8% 1,277 | 14.3% 373 |
| 1992 | 30.9% 1,017 | 42.4% 1,393 | 26.7% 879 |
| 1988 | 41.7% 1,443 | 57.2% 1,977 | 1.1% 38 |
| 1984 | 55.1% 1,959 | 44.0% 1,565 | 0.9% 31 |
| 1980 | 60.4% 2,165 | 33.0% 1,183 | 6.7% 239 |
| 1976 | 38.6% 1,430 | 59.0% 2,189 | 2.4% 89 |
| 1972 | 58.3% 2,038 | 39.8% 1,391 | 1.9% 67 |
| 1968 | 44.3% 1,494 | 49.3% 1,662 | 6.4% 214 |
| 1964 | 30.7% 1,131 | 69.2% 2,548 | 0.1% 4 |
| 1960 | 45.5% 1,894 | 54.4% 2,264 | 0.1% 5 |
| 1956 | 47.2% 1,699 | 52.6% 1,891 | 0.2% 7 |
| 1952 | 62.9% 2,516 | 35.9% 1,437 | 1.1% 45 |
| 1948 | 42.2% 1,395 | 46.0% 1,521 | 11.7% 388 |
| 1944 | 45.1% 1,666 | 53.6% 1,981 | 1.3% 46 |
| 1940 | 44.7% 1,981 | 53.9% 2,392 | 1.4% 62 |
| 1936 | 14.7% 700 | 58.2% 2,775 | 27.1% 1,294 |
| 1932 | 22.2% 986 | 73.8% 3,284 | 4.0% 178 |
| 1928 | 52.3% 2,354 | 44.5% 2,003 | 3.2% 144 |
| 1924 | 36.2% 1,354 | 3.5% 130 | 60.3% 2,257 |
| 1920 | 72.7% 2,960 | 16.9% 687 | 10.4% 423 |
| 1916 | 32.6% 740 | 55.7% 1,262 | 11.7% 265 |
| 1912 | 28.1% 407 | 21.2% 307 | 50.8% 737[20] |
References
- "State & County QuickFacts". United States Census Bureau. Archived from the original on June 7, 2011. Retrieved November 1, 2013.
- "Find a County". National Association of Counties. Retrieved June 7, 2011.
- "County History". North Dakota.gov. The State of North Dakota. Archived from the original on February 2, 2015. Retrieved February 1, 2015.
- Long, John H. (2006). "Dakota Territory, South Dakota, and North Dakota: Individual County Chronologies". Dakota Territory Atlas of Historical County Boundaries. The Newberry Library. Archived from the original on November 11, 2007. Retrieved February 25, 2019.
- "Dakota Territory Historical Counties: Interactive Map". Atlas of Historical County Boundaries. The Newberry Library. Archived from the original on August 11, 2006. Retrieved July 6, 2010.
- "North Dakota Historical Counties: Interactive Map". Atlas of Historical County Boundaries. The Newberry Library. Archived from the original on August 11, 2006. Retrieved July 6, 2010.
- Mountrail County ND Google Maps (accessed February 25, 2019)
- ""Find an Altitude/Mountrail County ND" Google Maps (accessed February 25, 2019)". Archived from the original on May 21, 2019. Retrieved February 25, 2019.
- "2010 Census Gazetteer Files". US Census Bureau. August 22, 2012. Archived from the original on January 29, 2015. Retrieved February 1, 2015.
- "Population and Housing Unit Estimates". Retrieved March 31, 2020.
- "US Decennial Census". US Census Bureau. Retrieved February 1, 2015.
- "Historical Census Browser". University of Virginia Library. Retrieved February 1, 2015.
- Forstall, Richard L., ed. (April 20, 1995). "Population of Counties by Decennial Census: 1900 to 1990". US Census Bureau. Retrieved February 1, 2015.
- "Census 2000 PHC-T-4. Ranking Tables for Counties: 1990 and 2000" (PDF). US Census Bureau. April 2, 2001. Retrieved February 1, 2015.
- "Profile of General Population and Housing Characteristics: 2010 Demographic Profile Data". US Census Bureau. Archived from the original on February 13, 2020. Retrieved March 14, 2016.
- "Population, Housing Units, Area, and Density: 2010 - County". US Census Bureau. Archived from the original on February 13, 2020. Retrieved March 14, 2016.
- "Selected Social Characteristics in the US – 2006-2010 American Community Survey 5-Year Estimates". US Census Bureau. Archived from the original on February 13, 2020. Retrieved March 14, 2016.
- "Selected Economic Characteristics – 2006-2010 American Community Survey 5-Year Estimates". US Census Bureau. Archived from the original on February 13, 2020. Retrieved March 14, 2016.
- Leip, David. "Atlas of US Presidential Elections". uselectionatlas.org. Retrieved April 13, 2018.
- The leading "other" candidate, Socialist Eugene Debs received 372 votes, Progressive Theodore Roosevelt, received 347 votes, while Prohibition candidate Eugene Chafin received 18 votes.
External links
Places adjacent to Mountrail County, North Dakota | ||||||||||
|---|---|---|---|---|---|---|---|---|---|---|
| ||||||||||
Municipalities and communities of Mountrail County, North Dakota, United States | ||
|---|---|---|
| Cities | Map of North Dakota highlighting Mountrail County | |
| Townships |
| |
| Unorganized territory |
| |
| Unincorporated communities | ||
| Ghost town | ||
| Indian reservation | ||
| Footnotes | ‡This populated place also has portions in an adjacent county or counties | |

| Authority control |
|
|---|