Wells County, North Dakota
Wells County is a county in the U.S. state of North Dakota. As of the 2010 United States Census, the population was 4,207.[1] Its county seat is Fessenden.[2]
Wells County | |
|---|---|
 Wells County Courthouse (Fessenden, North Dakota) | |
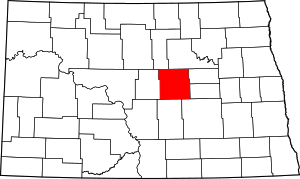 Location within the U.S. state of North Dakota | |
 North Dakota's location within the U.S. | |
| Coordinates: 47°35′N 99°40′W | |
| Country | |
| State | |
| Founded | January 4, 1873 (created) August 28, 1884 (organized) |
| Named for | Edward Payson Wells |
| Seat | Fessenden |
| Largest city | Harvey |
| Area | |
| • Total | 1,290 sq mi (3,300 km2) |
| • Land | 1,271 sq mi (3,290 km2) |
| • Water | 19 sq mi (50 km2) 1.5% |
| Population (2010) | |
| • Total | 4,207 |
| • Estimate (2019) | 3,834 |
| • Density | 3.3/sq mi (1.3/km2) |
| Time zone | UTC−6 (Central) |
| • Summer (DST) | UTC−5 (CDT) |
| Congressional district | At-large |
| Website | www |
History
The Dakota Territory legislature created the county on January 4, 1873. Its government was not organized at that time, nor was it attached for administrative or judicial purposes to another county. It was named Gingras County; this name continued until February 26, 1881, when the name was changed to Wells County, named for Edward Payson Wells, a Jamestown banker, early promoter of the James River Valley, and member of the legislature in 1881.
The county government was organized on August 28, 1884, with Sykeston as the county seat. In 1894 the county seat was transferred to Fessendon.[3] The county boundary was altered in 1883 when a parcel was transferred to Foster County, and again in 1885 when it received land from Foster County. Its boundary has remained unchanged since 1885.[4]
The center of population of North Dakota is located in the extreme southeastern corner of Wells County, about 9 miles (14 km) southeast of Sykeston.[5]
Geography
The James River flows east-northeasterly through Wells County. The county terrain consists of rolling hills with occasional protuberances, dotted with lakes and ponds in its SW portion.[6] The terrain slopes to the east and north; its highest point is a protuberance near the SW corner, at 2,182' (665m) ASL.[7] Ihe county has a total area of 1,290 square miles (3,300 km2), of which 1,271 square miles (3,290 km2) is land and 19 square miles (49 km2) (1.5%) is water.[8]
Major highways


- County 1[6]
- County 5
- County 52
Adjacent counties
- Benson County - north
- Eddy County - east
- Foster County - east
- Stutsman County - southeast
- Kidder County - south
- Sheridan County - west
- Pierce County - northwest
Protected areas[6]
- Karl T. Frederick State Game Management Area
- Upland State Game Refuge
Lakes[6]
- Big Slough
- Crystal Lake
- Egg Lake
- Lake Ontario
- Silver Lake
- Sorenson Lake
Demographics
| Historical population | |||
|---|---|---|---|
| Census | Pop. | %± | |
| 1890 | 1,212 | — | |
| 1900 | 8,310 | 585.6% | |
| 1910 | 11,814 | 42.2% | |
| 1920 | 12,957 | 9.7% | |
| 1930 | 13,285 | 2.5% | |
| 1940 | 11,198 | −15.7% | |
| 1950 | 10,417 | −7.0% | |
| 1960 | 9,237 | −11.3% | |
| 1970 | 7,847 | −15.0% | |
| 1980 | 6,979 | −11.1% | |
| 1990 | 5,864 | −16.0% | |
| 2000 | 5,102 | −13.0% | |
| 2010 | 4,207 | −17.5% | |
| Est. 2019 | 3,834 | [9] | −8.9% |
| US Decennial Census[10] 1790-1960[11] 1900-1990[12] 1990-2000[13] 2010-2019[1] | |||
2000 census
As of the 2000 United States Census, there were 5,102 people, 2,215 households, and 1,453 families in the county. The population density was 4.01/sqmi (1.55/km²). There were 2,643 housing units at an average density of 2.08/sqmi (0.80/km²). The racial makeup of the county was 99.12% White, 0.14% Black or African American, 0.24% Native American, 0.24% Asian, 0.02% from other races, and 0.25% from two or more races. 0.29% of the population were Hispanic or Latino of any race. 59.5% were of German and 24.1% Norwegian ancestry.
There were 2,215 households out of which 25.40% had children under the age of 18 living with them, 58.60% were married couples living together, 4.80% had a female householder with no husband present, and 34.40% were non-families. 32.60% of all households were made up of individuals and 18.60% had someone living alone who was 65 years of age or older. The average household size was 2.25 and the average family size was 2.85.
The county population contained 22.50% under the age of 18, 4.60% from 18 to 24, 22.70% from 25 to 44, 24.20% from 45 to 64, and 26.00% who were 65 years of age or older. The median age was 45 years. For every 100 females there were 96.60 males. For every 100 females age 18 and over, there were 94.00 males.
The median income for a household in the county was $31,894, and the median income for a family was $39,284. Males had a median income of $27,277 versus $16,810 for females. The per capita income for the county was $17,932. About 10.30% of families and 13.50% of the population were below the poverty line, including 11.10% of those under age 18 and 17.90% of those age 65 or over.
2010 census
As of the 2010 United States Census, there were 4,207 people, 1,943 households, and 1,223 families in the county.[14] The population density was 3.31/sqmi (1.28/km²). There were 2,481 housing units at an average density of 1.95/sqmi (0.75/km²).[15] The racial makeup of the county was 98.9% white, 0.3% American Indian, 0.1% black or African American, 0.1% Asian, 0.0% from other races, and 0.6% from two or more races. Those of Hispanic or Latino origin made up 0.5% of the population.[14] In terms of ancestry, 65.9% were German, 25.9% were Norwegian, 6.7% were Irish, and 1.8% were American.[16]
Of the 1,943 households, 19.7% had children under the age of 18 living with them, 54.1% were married couples living together, 5.6% had a female householder with no husband present, 37.1% were non-families, and 34.3% of all households were made up of individuals. The average household size was 2.10 and the average family size was 2.67. The median age was 51.5 years.[14]
The median income for a household in the county was $40,136 and the median income for a family was $52,400. Males had a median income of $38,442 versus $25,597 for females. The per capita income for the county was $23,531. About 6.1% of families and 10.3% of the population were below the poverty line, including 12.5% of those under age 18 and 17.1% of those age 65 or over.[17]
Communities
Census-designated place
Townships
- Berlin
- Bilodeau
- Bremen
- Bull Moose
- Cathay
- Chaseley
- Crystal Lake
- Delger
- Fairville
- Forward
- Fram
- Germantown
- Haaland
- Hamburg
- Hawksnest
- Heimdal
- Hillsdale
- Johnson
- Lynn
- Manfred
- Norway Lake
- Oshkosh
- Pony Gulch
- Progress
- Rusland
- Saint Anna
- Silver Lake
- South Cottonwood
- Speedwell
- Sykeston
- Valhalla
- Wells
- West Norway
- West Ontario
- Western
- Woodward
Politics
Wells County voters have been Republican-leaning for several decades. In no national election since 1964 has the county selected the Democratic Party candidate.
| Year | Republican | Democratic | Third parties |
|---|---|---|---|
| 2016 | 75.4% 1,796 | 17.6% 419 | 7.1% 168 |
| 2012 | 69.5% 1,654 | 28.3% 673 | 2.2% 52 |
| 2008 | 61.8% 1,468 | 35.4% 841 | 2.9% 68 |
| 2004 | 64.6% 1,654 | 33.5% 858 | 1.9% 49 |
| 2000 | 66.8% 1,610 | 27.4% 661 | 5.8% 139 |
| 1996 | 46.9% 1,192 | 37.8% 962 | 15.3% 388 |
| 1992 | 40.2% 1,171 | 30.5% 888 | 29.4% 857 |
| 1988 | 58.7% 1,901 | 40.6% 1,317 | 0.7% 23 |
| 1984 | 69.2% 2,426 | 29.6% 1,036 | 1.3% 44 |
| 1980 | 73.9% 2,660 | 20.7% 746 | 5.4% 193 |
| 1976 | 51.5% 1,941 | 46.2% 1,742 | 2.2% 84 |
| 1972 | 64.4% 2,519 | 33.2% 1,297 | 2.4% 94 |
| 1968 | 59.9% 2,266 | 33.5% 1,265 | 6.6% 251 |
| 1964 | 44.8% 1,875 | 55.2% 2,314 | |
| 1960 | 58.2% 2,641 | 41.6% 1,885 | 0.2% 9 |
| 1956 | 66.9% 2,912 | 32.9% 1,434 | 0.2% 9 |
| 1952 | 77.9% 3,709 | 21.3% 1,016 | 0.8% 37 |
| 1948 | 59.8% 2,385 | 37.4% 1,492 | 2.7% 109 |
| 1944 | 61.6% 2,529 | 37.9% 1,557 | 0.5% 20 |
| 1940 | 63.7% 3,335 | 35.9% 1,878 | 0.4% 19 |
| 1936 | 23.8% 1,263 | 58.8% 3,114 | 17.4% 921 |
| 1932 | 21.5% 1,062 | 77.4% 3,823 | 1.1% 54 |
| 1928 | 52.4% 2,364 | 47.1% 2,123 | 0.6% 25 |
| 1924 | 44.4% 1,644 | 3.7% 138 | 51.9% 1,921 |
| 1920 | 85.7% 3,202 | 12.2% 456 | 2.1% 78 |
| 1916 | 58.6% 1,226 | 38.7% 810 | 2.7% 57 |
| 1912 | 23.6% 356 | 32.7% 494 | 43.7% 660 |
| 1908 | 68.1% 1,243 | 29.3% 535 | 2.6% 48 |
| 1904 | 80.9% 1,330 | 12.7% 209 | 6.4% 105 |
| 1900 | 69.9% 966 | 28.1% 388 | 2.0% 28 |
References
- "State & County QuickFacts". United States Census Bureau. Retrieved November 1, 2013.
- "Find a County". National Association of Counties. Retrieved June 7, 2011.
- "County History". Official Portal for North Dakota State Government. Archived from the original on February 2, 2015. Retrieved May 4, 2011.
- "Dakota Territory, South Dakota, and North Dakota: Individual County Chronologies". Dakota Territory Atlas of Historical County Boundaries. The Newberry Library. 2006. Retrieved February 4, 2015.
- "2010 Census Centers of Population by State". US Census Bureau, Geography Division. Retrieved May 5, 2011.
- Wells County ND Google Maps (accessed 21 February 2019)
- ""Find an Altitude/Wells County ND" Google Maps (accessed 21 February 2019)". Archived from the original on May 21, 2019. Retrieved February 21, 2019.
- "2010 Census Gazetteer Files". US Census Bureau. August 22, 2012. Archived from the original on January 29, 2015. Retrieved February 1, 2015.
- "Population and Housing Unit Estimates". Retrieved April 3, 2020.
- "US Decennial Census". US Census Bureau. Retrieved February 1, 2015.
- "Historical Census Browser". University of Virginia Library. Retrieved February 1, 2015.
- Forstall, Richard L., ed. (April 20, 1995). "Population of Counties by Decennial Census: 1900 to 1990". US Census Bureau. Retrieved February 1, 2015.
- "Census 2000 PHC-T-4. Ranking Tables for Counties: 1990 and 2000" (PDF). US Census Bureau. April 2, 2001. Retrieved February 1, 2015.
- "Profile of General Population and Housing Characteristics: 2010 Demographic Profile Data". US Census Bureau. Archived from the original on February 13, 2020. Retrieved April 3, 2016.
- "Population, Housing Units, Area, and Density: 2010 - County". US Census Bureau. Archived from the original on February 13, 2020. Retrieved April 3, 2016.
- "Selected Social Characteristics in the US – 2006-2010 American Community Survey 5-Year Estimates". US Census Bureau. Archived from the original on February 13, 2020. Retrieved April 3, 2016.
- "Selected Economic Characteristics – 2006-2010 American Community Survey 5-Year Estimates". US Census Bureau. Archived from the original on February 13, 2020. Retrieved April 3, 2016.
- "Archived copy". Archived from the original on August 28, 2008. Retrieved February 21, 2019.CS1 maint: archived copy as title (link)
- Leip, David. "Atlas of US Presidential Elections". uselectionatlas.org. Retrieved April 13, 2018.
External links
- Wells County official website
- Northern portion of Wells County, North Dakota DOT
- Southern portion of Wells County, North Dakota DOT
Places adjacent to Wells County, North Dakota | ||||||||||
|---|---|---|---|---|---|---|---|---|---|---|
| ||||||||||
Municipalities and communities of Wells County, North Dakota, United States | ||
|---|---|---|
| Cities | Map of North Dakota highlighting Wells County | |
| Townships |
| |
| CDP | ||
| Unincorporated communities | ||

| Authority control |
|
|---|