Bowman County, North Dakota
Bowman County is a county in the U.S. state of North Dakota. As of the 2010 United States Census, the population was 3,151.[1] Its county seat is Bowman.[2]
Bowman County | |
|---|---|
 Dakota Western Bank in Bowman, North Dakota | |
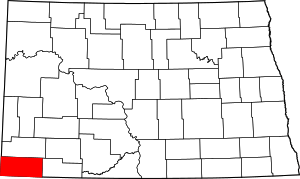 Location within the U.S. state of North Dakota | |
 North Dakota's location within the U.S. | |
| Coordinates: 46°07′N 103°31′W | |
| Country | |
| State | |
| Founded | 1883 (created) 1907 (organized) |
| Seat | Bowman |
| Largest city | Bowman |
| Area | |
| • Total | 1,167 sq mi (3,020 km2) |
| • Land | 1,162 sq mi (3,010 km2) |
| • Water | 5.2 sq mi (13 km2) 0.4% |
| Population (2010) | |
| • Total | 3,151 |
| • Estimate (2019) | 3,024 |
| • Density | 2.7/sq mi (1.0/km2) |
| Time zone | UTC−7 (Mountain) |
| • Summer (DST) | UTC−6 (MDT) |
| Congressional district | At-large |
| Website | www |
History
The legislature of the Dakota Territory designated Bowman (named for Edward M. Bowman, a member of the territorial House of Representatives during the 1883 session) as a separate county on March 8, 1883, although it was not organized at that time. In 1885, its boundaries were altered to cede territory to Billings and Villard Counties (Villard itself was eliminated in 1887). In 1891, and again in 1896, the South Dakota legislature eliminated the not-yet-organized Bowman County, due to scant settlement in the area, but these actions either were not put into effect (the 1891 vote) or were overturned in judicial appeal (the 1896 vote).
A decision by the North Dakota supreme court on May 24, 1901 resurrected Bowman County. That decision also caused the county's area to slightly increase; its former boundary descriptions were replaced by descriptions based on the boundary lines of adjacent jurisdictions, which added a strip along its south border and another strip along its east border.
Since the scantily-populated county was still unorganized, in March 1903 the legislature attached the area to Stark County for judicial purposes. This state of affairs continued until November 1904, when the legislature again dissolved the county and assigned its territory to Billings County. However, on June 10, 1907, ND Governor John Burke issued a proclamation which re-created Bowman County. This proclamation did not attach the area to any other area for judicial purposes, so on July 5, 1907 the new county's organization was set up, and Bowman was confirmed as the county seat.[3][4]
The US Navy ship USS Bowman County (LST-391), a tank landing ship in World War II, was named for this county.
Geography
Bowman County lies at the SW corner of North Dakota; its south boundary line abuts the north boundary line of the state of South Dakota, and its west boundary line abuts the east boundary line of the state of Montana. The Little Missouri River flows northward through the west part of the county; the North Fork of the Grand River flows easterly through the lower part of the county, filling Bowman-Haley Lake in the process. Spring Creek flows south-southeasterly through the central part of the county, discharging into Bowman-Haley Lake.
Bowman County's terrain consists of semi-arid high hills running north–south through the west-central part of the county, with lower hills in the remaining territory. The area is partially used for agriculture.[5] The western part slopes to the north and west; the eastern part slopes to the east and south. Its highest point is on the south boundary line, toward its SW corner, at 3,228' (984m) ASL.[6] The county has a total area of 1,167 square miles (3,020 km2), of which 1,162 square miles (3,010 km2) is land and 5.2 square miles (13 km2) (0.4%) is water.[7]
Major highways


Adjacent counties
- Slope County - north
- Adams County - east
- Harding County, South Dakota - south
- Fallon County, Montana - west
Lakes[5]
- Bowman-Haley Lake
- Gascoyne Lake
Demographics
| Historical population | |||
|---|---|---|---|
| Census | Pop. | %± | |
| 1910 | 4,668 | — | |
| 1920 | 4,768 | 2.1% | |
| 1930 | 5,119 | 7.4% | |
| 1940 | 3,860 | −24.6% | |
| 1950 | 4,001 | 3.7% | |
| 1960 | 4,154 | 3.8% | |
| 1970 | 3,901 | −6.1% | |
| 1980 | 4,229 | 8.4% | |
| 1990 | 3,596 | −15.0% | |
| 2000 | 3,242 | −9.8% | |
| 2010 | 3,151 | −2.8% | |
| Est. 2019 | 3,024 | [8] | −4.0% |
| US Decennial Census[9] 1790-1960[10] 1900-1990[11] 1990-2000[12] 2010-2019[1] | |||
2000 census
As of the 2000 United States Census, there were 3,242 people, 1,358 households, and 890 families in the county. The population density was 3 people per square mile (1/km²). There were 1,596 housing units at an average density of 1 per square mile (1/km²). The racial makeup of the county was 98.98% White, 0.03% Black or African American, 0.15% Native American, 0.03% Asian, 0.15% from other races, and 0.65% from two or more races. 0.68% of the population were Hispanic or Latino of any race. 41.1% were of German, 28.1% Norwegian, 5.3% Irish and 5.0% Polish ancestry.
There were 1,358 households out of which 29.50% had children under the age of 18 living with them, 59.50% were married couples living together, 4.10% had a female householder with no husband present, and 34.40% were non-families. 31.50% of all households were made up of individuals and 17.20% had someone living alone who was 65 years of age or older. The average household size was 2.32 and the average family size was 2.95.
The county population contained 24.10% under the age of 18, 5.30% from 18 to 24, 24.60% from 25 to 44, 24.20% from 45 to 64, and 21.80% who were 65 years of age or older. The median age was 43 years. For every 100 females there were 94.60 males. For every 100 females age 18 and over, there were 96.60 males.
The median income for a household in the county was $31,906, and the median income for a family was $39,485. Males had a median income of $28,682 versus $17,992 for females. The per capita income for the county was $17,662. About 5.90% of families and 8.20% of the population were below the poverty line, including 9.90% of those under age 18 and 10.40% of those age 65 or over.
2010 census
As of the 2010 United States Census, there were 3,151 people, 1,385 households, and 873 families in the county.[13] The population density was 2.7 inhabitants per square mile (1.0/km2). There were 1,683 housing units at an average density of 1.4 per square mile (0.54/km2).[14] The racial makeup of the county was 97.9% white, 0.6% American Indian, 0.1% black or African American, 0.1% Asian, 0.9% from other races, and 0.5% from two or more races. Those of Hispanic or Latino origin made up 2.5% of the population.[13] In terms of ancestry, 47.4% were German, 28.1% were Norwegian, 9.9% were Irish, 6.4% were Swedish, 6.4% were English, 5.4% were American, and 5.2% were Polish.[15]
Of the 1,385 households, 25.6% had children under the age of 18 living with them, 54.9% were married couples living together, 4.4% had a female householder with no husband present, 37.0% were non-families, and 32.9% of all households were made up of individuals. The average household size was 2.22 and the average family size was 2.82. The median age was 46.9 years.[13]
The median income for a household in the county was $48,063 and the median income for a family was $63,897. Males had a median income of $41,542 versus $27,269 for females. The per capita income for the county was $27,354. About 3.9% of families and 6.7% of the population were below the poverty line, including 2.6% of those under age 18 and 14.8% of those age 65 or over.[16]
Communities

Unincorporated communities[5]
- Griffin
- Haley
Townships
Unorganized Territories
Politics
Bowman County voters have been reliably Republican for decades. In no national election since 1964 has the county selected the Democratic Party candidate (as of 2016).
| Year | Republican | Democratic | Third parties |
|---|---|---|---|
| 2016 | 80.9% 1,446 | 12.7% 227 | 6.4% 114 |
| 2012 | 73.7% 1,280 | 23.8% 414 | 2.5% 43 |
| 2008 | 67.5% 1,107 | 29.2% 478 | 3.4% 55 |
| 2004 | 74.6% 1,280 | 23.1% 397 | 2.3% 39 |
| 2000 | 73.4% 1,080 | 22.4% 330 | 4.2% 61 |
| 1996 | 48.2% 710 | 33.2% 489 | 18.6% 274 |
| 1992 | 37.3% 712 | 26.5% 506 | 36.1% 689 |
| 1988 | 59.5% 1,111 | 39.5% 737 | 1.0% 19 |
| 1984 | 72.6% 1,559 | 26.2% 562 | 1.3% 28 |
| 1980 | 70.5% 1,507 | 21.2% 454 | 8.3% 177 |
| 1976 | 51.7% 1,033 | 45.6% 911 | 2.7% 54 |
| 1972 | 61.7% 1,111 | 35.7% 643 | 2.6% 47 |
| 1968 | 56.5% 927 | 34.0% 559 | 9.5% 156 |
| 1964 | 41.4% 756 | 58.6% 1,070 | 0.1% 1 |
| 1960 | 55.0% 1,038 | 44.9% 847 | 0.2% 3 |
| 1956 | 58.3% 1,007 | 41.4% 715 | 0.2% 4 |
| 1952 | 71.2% 1,375 | 28.0% 540 | 0.8% 16 |
| 1948 | 49.8% 723 | 41.1% 597 | 9.0% 131 |
| 1944 | 55.7% 785 | 43.2% 609 | 1.1% 16 |
| 1940 | 50.6% 927 | 48.2% 882 | 1.2% 22 |
| 1936 | 26.6% 534 | 55.6% 1,118 | 17.8% 358 |
| 1932 | 28.3% 616 | 59.4% 1,292 | 12.3% 268 |
| 1928 | 55.0% 1,031 | 43.8% 821 | 1.2% 23 |
| 1924 | 45.2% 776 | 3.9% 67 | 50.9% 875 |
| 1920 | 69.8% 1,192 | 18.8% 321 | 11.4% 195 |
| 1916 | 32.5% 374 | 59.5% 685 | 8.0% 92 |
| 1912 | 29.2% 302 | 34.9% 361 | 35.9% 372[18] |
| 1908 | 66.1% 451 | 30.7% 209 | 3.2% 22 |
See also
References
- "State & County QuickFacts". United States Census Bureau. Retrieved October 31, 2013.
- "Find a County". National Association of Counties. Archived from the original on May 31, 2011. Retrieved June 7, 2011.
- "Dakota Territory, South Dakota, and North Dakota: Individual County Chronologies". Dakota Territory Atlas of Historical County Boundaries. The Newberry Library. 2006. Retrieved February 2, 2015.
- "County History". Official Portal for North Dakota State Government. Archived from the original on February 2, 2015. Retrieved May 4, 2011.
- Bowman County ND Google Maps (accessed February 15, 2019)
- ""Find an Altitude/Bowman County ND" Google Maps (accessed February 15, 2019)". Archived from the original on May 21, 2019. Retrieved February 15, 2019.
- "2010 Census Gazetteer Files". US Census Bureau. August 22, 2012. Archived from the original on January 29, 2015. Retrieved January 27, 2015.
- "Population and Housing Unit Estimates". Retrieved April 3, 2020.
- "US Decennial Census". US Census Bureau. Retrieved January 27, 2015.
- "Historical Census Browser". University of Virginia Library. Retrieved January 27, 2015.
- Forstall, Richard L., ed. (March 27, 1995). "Population of Counties by Decennial Census: 1900 to 1990". US Census Bureau. Retrieved January 27, 2015.
- "Census 2000 PHC-T-4. Ranking Tables for Counties: 1990 and 2000" (PDF). US Census Bureau. April 2, 2001. Retrieved January 27, 2015.
- "Profile of General Population and Housing Characteristics: 2010 Demographic Profile Data". US Census Bureau. Archived from the original on February 13, 2020. Retrieved March 14, 2016.
- "Population, Housing Units, Area, and Density: 2010 - County". US Census Bureau. Archived from the original on February 13, 2020. Retrieved March 14, 2016.
- "Selected Social Characteristics in the US – 2006-2010 American Community Survey 5-Year Estimates". US Census Bureau. Archived from the original on February 13, 2020. Retrieved March 14, 2016.
- "Selected Economic Characteristics – 2006-2010 American Community Survey 5-Year Estimates". US Census Bureau. Archived from the original on February 13, 2020. Retrieved March 14, 2016.
- Leip, David. "Atlas of US Presidential Elections". uselectionatlas.org. Retrieved April 12, 2018.
- The leading "other" candidate, Progressive Theodore Roosevelt, received 258 votes, while Socialist candidate Eugene Debs received 99 votes, Prohibition candidate Eugene Chafin received 15 votes.
External links
- Bowman County map, North Dakota DOT
Places adjacent to Bowman County, North Dakota | ||||||||||
|---|---|---|---|---|---|---|---|---|---|---|
| ||||||||||
Municipalities and communities of Bowman County, North Dakota, United States | ||
|---|---|---|
| Cities | Map of North Dakota highlighting Bowman County | |
| Townships | ||
| Unorganized territories | ||
| Unincorporated communities |
| |

| Authority control |
|
|---|