Benson County, North Dakota
Benson County is a county in the U.S. state of North Dakota. As of the 2010 United States Census, the population was 6,660.[1] Its county seat is Minnewaukan.[2] The county was created on March 9, 1883[3] by the Dakota Territory legislature, and was named for Bertil W. Benson, a Dakota Territory legislator at the time. The county government was organized on June 4, 1884, and its boundary lines were altered by two legislative actions in 1885.[4]
Benson County | |
|---|---|
 | |
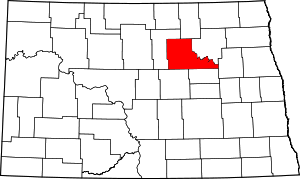 Location within the U.S. state of North Dakota | |
 North Dakota's location within the U.S. | |
| Coordinates: 48°04′N 99°22′W | |
| Country | |
| State | |
| Founded | March 9, 1883 (created) June 4, 1884 (organized) |
| Named for | Bertil W. Benson |
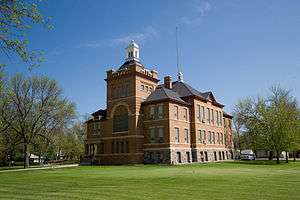
| Seat | Minnewaukan |
| Largest community | Fort Totten |
| Area | |
| • Total | 1,439 sq mi (3,730 km2) |
| • Land | 1,389 sq mi (3,600 km2) |
| • Water | 51 sq mi (130 km2) 3.5% |
| Population (2010) | |
| • Total | 6,660 |
| • Estimate (2019) | 6,832 |
| • Density | 4.6/sq mi (1.8/km2) |
| Time zone | UTC−6 (Central) |
| • Summer (DST) | UTC−5 (CDT) |
| Congressional district | At-large |
| Website | www |
White Horse Hill National Game Preserve and much of the Spirit Lake Indian Reservation are located within the county.
Geography
Much of the east boundary line of Benson County is delineated by the shore of Devils Lake, a closed-capture lake which would spill into the Sheyenne River in an overflow condition. The North Fork Sheyenne River flows southeasterly through the lower SW portion of the county.
The terrain of Benson County consists of rolling hills dotted with lakes, ponds and drainages.[5] The terrain slopes to the east, and its highest point is on the lower portion of its west boundary line, at 1,624' (495m) ASL.[6] The county has a total area of 1,439 square miles (3,730 km2), of which 1,389 square miles (3,600 km2) is land and 51 square miles (130 km2) (3.5%) is water.[7]
Adjacent counties
- Towner County – north
- Ramsey County – northeast
- Nelson County – east
- Eddy County – southeast
- Wells County – southwest
- Pierce County – west
Major highways


Protected areas
- Buffalo Lake National Wildlife Refuge (part)
- Grahams Island State Park (part)
- Pleasant Lake National Wildlife Refuge
- Silver Lake National Wildlife Refuge (part)
- White Horse Hill National Game Preserve
- Volk National Wildlife Refuge[5]
- Wood Lake National Wildlife Refuge
- Wurgler National Wildlife Refuge[5]
Lakes[5]
- Broken Bone Lake
- Cranberry Lake
- Free Peoples Lake
- Horseshoe Lake
- Lake Murie
- Lake Yri
- Long Lake
- Sand Lake
- Shin Bone Lake
- Spring Lake
- Stink Lake
- Stony Lake
- Wood Lake
Demographics
| Historical population | |||
|---|---|---|---|
| Census | Pop. | %± | |
| 1890 | 2,460 | — | |
| 1900 | 8,320 | 238.2% | |
| 1910 | 12,681 | 52.4% | |
| 1920 | 13,095 | 3.3% | |
| 1930 | 13,327 | 1.8% | |
| 1940 | 12,629 | −5.2% | |
| 1950 | 10,675 | −15.5% | |
| 1960 | 9,435 | −11.6% | |
| 1970 | 8,245 | −12.6% | |
| 1980 | 7,944 | −3.7% | |
| 1990 | 7,198 | −9.4% | |
| 2000 | 6,964 | −3.3% | |
| 2010 | 6,660 | −4.4% | |
| Est. 2019 | 6,832 | [8] | 2.6% |
| US Decennial Census[9] 1790-1960[10] 1900-1990[11] 1990-2000[12] 2010-2019[1] | |||
2000 census
As of the 2000 United States Census, there were 6,964 people, 2,328 households, and 1,701 families in the county. The population density was 5 people per square mile (2/km²). There were 2,932 housing units at an average density of 2 per square mile (1/km²). The racial makeup of the county was mostly White (50.85%) and Native American (48.05%). In addition, 0.10% are Black/African American, 0.01% are Asian, 0.01% are Pacific Islander, 0.16% are from other races, and 0.82% are from two or more races. 0.79% of the population were Hispanic or Latino of any race. 25.2% were of Norwegian and 14.8% German ancestry.
There were 2,328 households out of which 38.00% had children under the age of 18 living with them, 48.50% were married couples living together, 16.60% had a female householder with no husband present, and 26.90% were non-families. 24.50% of all households were made up of individuals and 12.50% had someone living alone who was 65 years of age or older. The average household size was 2.97 and the average family size was 3.48.
The county population contained 36.10% under the age of 18, 7.80% from 18 to 24, 23.30% from 25 to 44, 19.40% from 45 to 64, and 13.50% who were 65 years of age or older. The median age was 31 years. For every 100 females there were 102.10 males. For every 100 females age 18 and over, there were 102.00 males.
The median income for a household in the county was $26,688, and the median income for a family was $31,558. Males had a median income of $23,056 versus $17,862 for females. The per capita income for the county was $11,509. About 24.40% of families and 29.10% of the population were below the poverty line, including 38.90% of those under age 18 and 16.70% of those age 65 or over.
2010 census
As of the 2010 United States Census, there were 6,660 people, 2,233 households, and 1,628 families in the county.[13] The population density was 4.8 inhabitants per square mile (1.9/km2). There were 2,950 housing units at an average density of 2.1 per square mile (0.81/km2).[14] The racial makeup of the county was 55.0% American Indian, 43.4% white, 0.2% from other races, and 1.4% from two or more races. Those of Hispanic or Latino origin made up 1.2% of the population.[13] In terms of ancestry, 22.0% were Norwegian, 18.0% were German, 5.0% were Irish, and 0.6% were American.[15]
Of the 2,233 households, 41.3% had children under the age of 18 living with them, 42.3% were married couples living together, 20.6% had a female householder with no husband present, 27.1% were non-families, and 23.2% of all households were made up of individuals. The average household size was 2.98 and the average family size was 3.46. The median age was 31.6 years.[13]
The median income for a household in the county was $30,479 and the median income for a family was $34,597. Males had a median income of $31,729 versus $25,253 for females. The per capita income for the county was $14,545. About 26.1% of families and 35.6% of the population were below the poverty line, including 48.3% of those under age 18 and 16.9% of those age 65 or over.[16]
Population by decade

Communities
Census-designated place
Unincorporated communities
Townships
- Albert
- Arne
- Aurora
- Beaver
- Broe
- Butte Valley
- East Fork
- Eldon
- Esmond
- Hesper
- Impark
- Iowa
- Irvine
- Isabel
- Knox
- Lake Ibsen
- Lallie
- Leeds
- Lohnes
- McClellan
- Minco
- Mission
- Normania
- North Viking
- Oberon
- Pleasant Lake
- Rich Valley
- Riggin
- Rock
- South Viking
- Twin Lake
- Twin Tree
- Warwick
- West Antelope
- West Bay
- Wood Lake
- York
Politics
Typical of many counties in the state where a significant share of the population is Native American, Benson County leans Democratic in presidential elections. No Republican candidate has won the majority of the county's votes since Ronald Reagan in 1984. However, George W. Bush in 2000 & Donald Trump in 2016 both won a plurality of the county's votes.
| Year | Republican | Democratic | Third parties |
|---|---|---|---|
| 2016 | 46.2% 929 | 41.9% 842 | 11.9% 240 |
| 2012 | 40.2% 868 | 57.3% 1,235 | 2.5% 54 |
| 2008 | 32.6% 773 | 66.1% 1,569 | 1.4% 32 |
| 2004 | 44.6% 1,002 | 53.3% 1,196 | 2.1% 48 |
| 2000 | 49.0% 1,055 | 44.2% 952 | 6.8% 147 |
| 1996 | 39.1% 850 | 48.8% 1,059 | 12.1% 263 |
| 1992 | 33.3% 874 | 42.9% 1,126 | 23.8% 625 |
| 1988 | 43.4% 1,316 | 55.8% 1,691 | 0.8% 24 |
| 1984 | 51.4% 1,729 | 47.6% 1,599 | 1.0% 35 |
| 1980 | 59.9% 2,149 | 31.2% 1,119 | 8.9% 319 |
| 1976 | 45.3% 1,689 | 53.0% 1,973 | 1.7% 63 |
| 1972 | 55.1% 2,050 | 43.9% 1,635 | 1.0% 36 |
| 1968 | 46.9% 1,707 | 48.6% 1,772 | 4.5% 164 |
| 1964 | 36.7% 1,489 | 63.2% 2,566 | 0.1% 5 |
| 1960 | 50.8% 2,259 | 49.1% 2,181 | 0.1% 3 |
| 1956 | 55.7% 2,340 | 44.0% 1,851 | 0.3% 12 |
| 1952 | 69.6% 3,192 | 29.5% 1,353 | 0.9% 39 |
| 1948 | 44.3% 1,920 | 51.2% 2,216 | 4.5% 195 |
| 1944 | 43.0% 1,726 | 56.4% 2,261 | 0.6% 23 |
| 1940 | 45.9% 2,485 | 53.5% 2,898 | 0.7% 37 |
| 1936 | 19.0% 1,020 | 62.3% 3,343 | 18.7% 1,000 |
| 1932 | 23.8% 1,170 | 74.2% 3,650 | 2.0% 97 |
| 1928 | 53.8% 2,621 | 45.0% 2,194 | 1.2% 57 |
| 1924 | 45.0% 1,870 | 5.9% 246 | 49.1% 2,040 |
| 1920 | 81.1% 3,540 | 15.6% 680 | 3.3% 145 |
| 1916 | 53.3% 1,210 | 40.6% 922 | 6.1% 138 |
| 1912 | 26.1% 515 | 30.1% 594 | 43.7% 862 |
| 1908 | 67.8% 1,363 | 27.5% 553 | 4.7% 94 |
| 1904 | 85.6% 1,111 | 11.0% 143 | 3.4% 44 |
| 1900 | 75.5% 1,084 | 22.2% 319 | 2.3% 33 |
References
- "State & County QuickFacts". United States Census Bureau. Retrieved October 31, 2013.
- "Find a County". National Association of Counties. Archived from the original on May 31, 2011. Retrieved June 7, 2011.
- Another source shows the county's creation in 1879: ND Government - State History/Benson County (accessed 13 February 2019)
- "Dakota Territory, South Dakota, and North Dakota: Individual County Chronologies". Dakota Territory Atlas of Historical County Boundaries. The Newberry Library. 2006. Retrieved February 2, 2015.
- Benson County ND Google Maps (accessed 13 February 2019)
- ""Find an Altitude" Google Maps - Benson County ND (accessed 13 February 2019)". Archived from the original on May 21, 2019. Retrieved February 14, 2019.
- "2010 Census Gazetteer Files". US Census Bureau. August 22, 2012. Archived from the original on January 29, 2015. Retrieved January 27, 2015.
- "Population and Housing Unit Estimates". Retrieved April 2, 2020.
- "US Decennial Census". US Census Bureau. Retrieved January 27, 2015.
- "Historical Census Browser". University of Virginia Library. Retrieved January 27, 2015.
- Forstall, Richard L., ed. (March 27, 1995). "Population of Counties by Decennial Census: 1900 to 1990". US Census Bureau. Retrieved January 27, 2015.
- "Census 2000 PHC-T-4. Ranking Tables for Counties: 1990 and 2000" (PDF). US Census Bureau. April 2, 2001. Retrieved January 27, 2015.
- "Profile of General Population and Housing Characteristics: 2010 Demographic Profile Data". US Census Bureau. Archived from the original on February 13, 2020. Retrieved March 14, 2016.
- "Population, Housing Units, Area, and Density: 2010 - County". US Census Bureau. Archived from the original on February 13, 2020. Retrieved March 14, 2016.
- "Selected Social Characteristics in the US – 2006-2010 American Community Survey 5-Year Estimates". US Census Bureau. Archived from the original on February 13, 2020. Retrieved March 14, 2016.
- "Selected Economic Characteristics – 2006-2010 American Community Survey 5-Year Estimates". US Census Bureau. Archived from the original on February 13, 2020. Retrieved March 14, 2016.
- Leip, David. "Atlas of US Presidential Elections". uselectionatlas.org. Retrieved April 12, 2018.
External links
Places adjacent to Benson County, North Dakota | ||||||||||
|---|---|---|---|---|---|---|---|---|---|---|
| ||||||||||
Municipalities and communities of Benson County, North Dakota, United States | ||
|---|---|---|
| Cities | Map of North Dakota highlighting Benson County | |
| Townships |
| |
| CDP | ||
| Unincorporated communities | ||

| Authority control |
|
|---|