Sargent County, North Dakota
Sargent County is a county in the U.S. state of North Dakota. As of the 2010 United States Census, the population was 3,829.[2] Its county seat is Forman.[3]
Sargent County | |
|---|---|
 | |
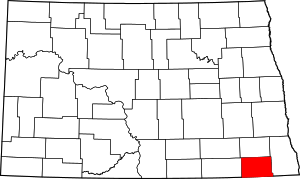 Location within the U.S. state of North Dakota | |
 North Dakota's location within the U.S. | |
| Coordinates: 46°07′N 97°38′W | |
| Country | |
| State | |
| Founded | April 9, 1883 (created) October 8, 1883 (organized)[1] |
| Named for | H. E. Sargent |
| Seat | Forman |
| Largest city | Gwinner |
| Area | |
| • Total | 867 sq mi (2,250 km2) |
| • Land | 859 sq mi (2,220 km2) |
| • Water | 8.4 sq mi (22 km2) 1.0% |
| Population (2010) | |
| • Total | 3,829 |
| • Estimate (2019) | 3,898 |
| • Density | 4.4/sq mi (1.7/km2) |
| Time zone | UTC−6 (Central) |
| • Summer (DST) | UTC−5 (CDT) |
| Congressional district | At-large |
| Website | www |
History
The Dakota Territory created the county on April 9, 1883, with areas partitioned from Ransom County, from previously unorganized areas, and from non-county areas in the Wahpeton and Sisseton Indian Reserve. It was named for H. E. Sargent, a railroad executive.[4] Its governing structure was not completed at that time, so it was attached to Richland for judicial purposes and to Ransom for administrative purposes. This arrangement only lasted until October 8, when the county government was effected,[1][5][6] with Milnor as the county seat. However, in 1884, in the county's first election, Forman was chosen as the county seat.[4]
The Northern Pacific Railroad laid a line into the county in 1883, reaching Milnor. By 1900 it had been extended across the county. The county's population rapidly increased, reaching a peak in the 1920 census (9,655).[4]

In 1997 the Brampton Lutheran Church (originally built in 1908) was moved to Sletta near Radøy in Norway and reconstructed there. It is now called Emigrantkirka (Emigrant Church).
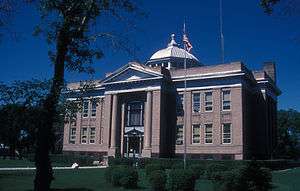
The Sargent County Courthouse, a Beaux Arts-style building built in 1910, is listed on the U.S. National Register of Historic Places.
Geography
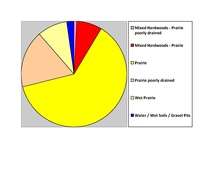
Sargent County lies on the south line of North Dakota. Its south boundary line abuts the north boundary line of the state of South Dakota. The Wild Rice River rises as an intermittent stream in Brampton Township in southeastern Sargent County, approximately 6 miles (10 km) south of Cogswell. It flows generally easterly through the southern part of the county. The county terrain consists of rolling hills, punctuated with ponds and lakes, with isolated higher areas. The area is largely devoted to agriculture.[7] The terrain generally slopes to the south and east, with its highest point on its western boundary line at 1,365' (416m) ASL, although a NW-SE rise on the eastern portion of its south boundary line rises to 1,729' (527m) ASL.[8] The county has a total area of 867 square miles (2,250 km2), of which 859 square miles (2,220 km2) is land and 8.4 square miles (22 km2) (1.0%) is water.[9]
Major highways


Adjacent counties
- Ransom County - north
- Richland County - east
- Roberts County, South Dakota - southeast
- Marshall County, South Dakota - south
- Brown County, South Dakota - southwest
- Dickey County - west
National protected areas
Lakes[7]
- Alkali Lake
- Borg Lake
- Buffalo Lake
- Clouds Lake
- Golden Hill Lake
- Kraft Lake
- Lake Dell
- Lake Fedge
- Lake Tewaukon
- Pickell Lake
- Silver Lake
- Sprague Lake
- Storm Lake
- White Lake
Demographics
| Historical population | |||
|---|---|---|---|
| Census | Pop. | %± | |
| 1890 | 5,076 | — | |
| 1900 | 6,039 | 19.0% | |
| 1910 | 9,202 | 52.4% | |
| 1920 | 9,655 | 4.9% | |
| 1930 | 9,298 | −3.7% | |
| 1940 | 8,693 | −6.5% | |
| 1950 | 7,616 | −12.4% | |
| 1960 | 6,856 | −10.0% | |
| 1970 | 5,937 | −13.4% | |
| 1980 | 5,512 | −7.2% | |
| 1990 | 4,549 | −17.5% | |
| 2000 | 4,366 | −4.0% | |
| 2010 | 3,829 | −12.3% | |
| Est. 2019 | 3,898 | [10] | 1.8% |
| US Decennial Census[11] 1790-1960[12] 1900-1990[13] 1990-2000[14] 2010-2019[2] | |||
2000 census
As of the 2000 United States Census, there were 4,366 people, 1,786 households, and 1,243 families in the county. The population density was 5.08/sqmi (1.96/km²). There were 2,016 housing units at an average density of 2.35/sqmi (0.91/km²). The racial makeup of the county was 98.24% White, 0.05% Black or African American, 0.46% Native American, 0.05% Asian, 0.55% from other races, and 0.66% from two or more races. 0.73% of the population were Hispanic or Latino of any race. 37.5% were of German and 35.4% Norwegian ancestry.
There were 1,786 households out of which 30.30% had children under the age of 18 living with them, 61.00% were married couples living together, 3.90% had a female householder with no husband present, and 30.40% were non-families. 27.70% of all households were made up of individuals and 14.10% had someone living alone who was 65 years of age or older. The average household size was 2.43 and the average family size was 2.99.
The county population contained 26.50% under the age of 18, 5.30% from 18 to 24, 25.70% from 25 to 44, 25.70% from 45 to 64, and 16.90% who were 65 years of age or older. The median age was 40 years. For every 100 females there were 110.60 males. For every 100 females age 18 and over, there were 110.10 males.
The median income for a household in the county was $37,213, and the median income for a family was $44,063. Males had a median income of $34,222 versus $19,844 for females. The per capita income for the county was $18,689. About 6.00% of families and 8.20% of the population were below the poverty line, including 8.90% of those under age 18 and 11.80% of those age 65 or over.
2010 census
As of the 2010 United States Census, there were 3,829 people, 1,675 households, and 1,113 families in the county.[15] The population density was 4.46/sqmi (1.72/km²). There were 2,004 housing units at an average density of 2.33/sqmi (0.90/km²).[16] The racial makeup of the county was 98.0% white, 0.5% American Indian, 0.2% Asian, 0.1% Pacific islander, 0.1% black or African American, 0.3% from other races, and 0.7% from two or more races. Those of Hispanic or Latino origin made up 1.3% of the population.[15] In terms of ancestry, 51.3% were German, 35.9% were Norwegian, 11.8% were Swedish, 8.4% were Irish, and 3.0% were American.[17]
Of the 1,675 households, 27.1% had children under the age of 18 living with them, 57.3% were married couples living together, 4.7% had a female householder with no husband present, 33.6% were non-families, and 30.2% of all households were made up of individuals. The average household size was 2.26 and the average family size was 2.79. The median age was 45.9 years.[15]
The median income for a household in the county was $49,318 and the median income for a family was $59,531. Males had a median income of $43,594 versus $30,152 for females. The per capita income for the county was $26,553. About 5.7% of families and 7.8% of the population were below the poverty line, including 10.5% of those under age 18 and 10.4% of those age 65 or over.[18]
Communities
Census-designated place
Townships
- Bowen
- Brampton
- Denver
- Dunbar
- Forman
- Hall
- Harlem
- Herman
- Jackson
- Kingston
- Marboe
- Milnor
- Ransom
- Rutland
- Sargent
- Shuman
- Southwest
- Taylor
- Tewaukon
- Verner
- Vivian
- Weber
- Whitestone Hill
- Willey
Politics
Sargent County is a swing county in presidential elections, having voted for both parties an equal number of times since 1980. From 1948 on, it has backed the national winner in every presidential election except for 1988, in which a majority of the county's votes went to Michael Dukakis.
| Year | Republican | Democratic | Third parties |
|---|---|---|---|
| 2016 | 54.5% 1,088 | 34.8% 694 | 10.8% 215 |
| 2012 | 43.8% 879 | 53.6% 1,075 | 2.6% 53 |
| 2008 | 40.4% 778 | 57.9% 1,115 | 1.8% 34 |
| 2004 | 52.1% 1,147 | 46.4% 1,021 | 1.5% 32 |
| 2000 | 50.5% 1,103 | 43.9% 959 | 5.6% 122 |
| 1996 | 39.4% 814 | 48.5% 1,003 | 12.1% 250 |
| 1992 | 36.2% 816 | 42.6% 961 | 21.2% 477 |
| 1988 | 45.9% 1,119 | 53.6% 1,306 | 0.5% 11 |
| 1984 | 50.8% 1,385 | 47.5% 1,295 | 1.7% 45 |
| 1980 | 55.4% 1,565 | 37.1% 1,048 | 7.4% 210 |
| 1976 | 44.3% 1,344 | 54.2% 1,644 | 1.4% 43 |
| 1972 | 54.5% 1,616 | 44.9% 1,331 | 0.6% 19 |
| 1968 | 48.7% 1,386 | 45.9% 1,308 | 5.5% 155 |
| 1964 | 39.2% 1,189 | 60.7% 1,840 | 0.1% 4 |
| 1960 | 49.0% 1,591 | 51.0% 1,655 | 0.1% 2 |
| 1956 | 52.9% 1,662 | 46.9% 1,473 | 0.2% 7 |
| 1952 | 65.8% 2,124 | 33.8% 1,090 | 0.5% 16 |
| 1948 | 45.7% 1,387 | 49.7% 1,506 | 4.6% 140 |
| 1944 | 50.7% 1,488 | 48.6% 1,426 | 0.7% 20 |
| 1940 | 50.0% 1,922 | 49.3% 1,894 | 0.7% 27 |
| 1936 | 24.1% 863 | 64.5% 2,306 | 11.4% 408 |
| 1932 | 21.2% 785 | 76.0% 2,818 | 2.9% 106 |
| 1928 | 46.9% 1,772 | 52.6% 1,989 | 0.5% 19 |
| 1924 | 43.7% 1,468 | 6.9% 232 | 49.4% 1,661 |
| 1920 | 78.2% 2,787 | 18.9% 673 | 3.0% 105 |
| 1916 | 52.6% 1,050 | 43.5% 868 | 3.9% 78 |
| 1912 | 37.0% 605 | 39.2% 641 | 23.8% 389 |
| 1908 | 61.5% 1,012 | 35.0% 576 | 3.5% 58 |
| 1904 | 71.6% 1,045 | 21.3% 310 | 7.1% 104 |
| 1900 | 56.3% 765 | 41.5% 564 | 2.3% 31 |
References
- The Sargent County website cites July 16, 1883 as the date of organization, when Territory Governor Ordway named the first commissioners.
- "State & County QuickFacts". United States Census Bureau. Retrieved November 1, 2013.
- "Find a County". National Association of Counties. Retrieved June 7, 2011.
- A Little History (Sargent County website, accessed 24 February 2019)
- "Dakota Territory, South Dakota, and North Dakota: Individual County Chronologies". Dakota Territory Atlas of Historical County Boundaries. The Newberry Library. 2006. Retrieved February 24, 2019.
- "County History". North Dakota.gov. The State of North Dakota. Archived from the original on February 2, 2015. Retrieved February 4, 2015.
- Sargent County ND Google Maps (accessed 24 February 2019)
- ""Find an Altitude/Sargent County ND" Google Maps (accessed 24 February 2019)". Archived from the original on May 21, 2019. Retrieved February 24, 2019.
- "2010 Census Gazetteer Files". US Census Bureau. August 22, 2012. Archived from the original on January 29, 2015. Retrieved February 1, 2015.
- "Population and Housing Unit Estimates". Retrieved April 3, 2020.
- "US Decennial Census". US Census Bureau. Retrieved February 1, 2015.
- "Historical Census Browser". University of Virginia Library. Retrieved February 1, 2015.
- Forstall, Richard L., ed. (April 20, 1995). "Population of Counties by Decennial Census: 1900 to 1990". US Census Bureau. Retrieved February 1, 2015.
- "Census 2000 PHC-T-4. Ranking Tables for Counties: 1990 and 2000" (PDF). US Census Bureau. April 2, 2001. Retrieved February 1, 2015.
- "Profile of General Population and Housing Characteristics: 2010 Demographic Profile Data". US Census Bureau. Archived from the original on February 13, 2020. Retrieved April 3, 2016.
- "Population, Housing Units, Area, and Density: 2010 - County". US Census Bureau. Archived from the original on February 13, 2020. Retrieved April 3, 2016.
- "Selected Social Characteristics in the US – 2006-2010 American Community Survey 5-Year Estimates". US Census Bureau. Archived from the original on February 13, 2020. Retrieved April 3, 2016.
- "Selected Economic Characteristics – 2006-2010 American Community Survey 5-Year Estimates". US Census Bureau. Archived from the original on February 13, 2020. Retrieved April 3, 2016.
- Leip, David. "Atlas of US Presidential Elections". uselectionatlas.org. Retrieved April 13, 2018.
External links
- Sargent County map, North Dakota DOT
Places adjacent to Sargent County, North Dakota | ||||||||||
|---|---|---|---|---|---|---|---|---|---|---|
| ||||||||||
Municipalities and communities of Sargent County, North Dakota, United States | ||
|---|---|---|
| Cities | Map of North Dakota highlighting Sargent County | |
| Townships | ||
| CDP | ||
| Unincorporated community |
| |
| Indian reservations | ||
| Footnotes | ‡This populated place also has portions in an adjacent county or counties | |

| Authority control |
|
|---|