Renville County, North Dakota
Renville County is a county in the U.S. state of North Dakota. As of the 2010 United States Census, the population was 2,470.[1] Its county seat is Mohall.[2]
Renville County | |
|---|---|
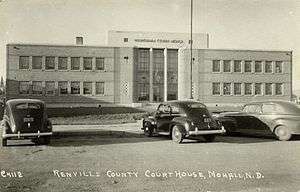 Renville County Courthouse. Photographed in 1940. | |
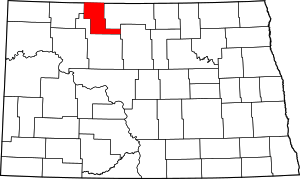 Location within the U.S. state of North Dakota | |
 North Dakota's location within the U.S. | |
| Coordinates: 48°43′N 101°40′W | |
| Country | |
| State | |
| Founded | January 4, 1873 (created) July 20, 1910 (organized) |
| Named for | Joseph Renville |
| Seat | Mohall |
| Largest city | Mohall |
| Area | |
| • Total | 893 sq mi (2,310 km2) |
| • Land | 877 sq mi (2,270 km2) |
| • Water | 16 sq mi (40 km2) 1.8% |
| Population (2010) | |
| • Total | 2,470 |
| • Estimate (2019) | 2,327 |
| • Density | 2.8/sq mi (1.1/km2) |
| Time zone | UTC−6 (Central) |
| • Summer (DST) | UTC−5 (CDT) |
| Congressional district | At-large |
| Website | www |
Renville County is part of the Minot, ND Micropolitan Statistical Area. It is located south of the Canada–United States border with Saskatchewan.
History
The Dakota Territory legislature created the county on January 4, 1873. It was named for Joseph Renville, an influential fur trader, interpreter, translator, and important figure in dealings between white men and the Sioux. The county was not organized at that time, nor was it attached to another county for administrative or judicial purposes. The proposed county boundaries were altered in 1883, in 1885, and 1887, and on November 8, 1892, the county was dissolved and absorbed into Bottineau and Ward counties due to a lack of settlement.
The general election held November 3, 1908 included a question asking whether a portion of Ward County should be partitioned off and named Renville County (covering a different area than the original county). This question reportedly failed to pass, but it was promptly contested in court, resulting in a ruling by the state Supreme Court ruled on June 3, 1910, that the split should be carried out. The state governor proclaimed the result in a July 12 proclamation, and the county government was organized on July 20 of that year,[3] with Mohall as the county seat.[3][4]
Geography
Renville County lies on the north line of North Dakota; its north boundary line abuts the south boundary line of Canada. The Souris River flows southeasterly through the county on its way to Hudson Bay. The county terrain consists of rolling hills, largely devoted to agriculture.[5] The terrain slopes to the south and east; its highest point is its SW corner, at 2,005' (611m) ASL.[6] The county has a total area of 893 square miles (2,310 km2), of which 877 square miles (2,270 km2) is land and 16 square miles (41 km2) (1.8%) is water.[7]
Major highways


Adjacent counties and rural municipalities
- Mount Pleasant No. 2, Saskatchewan - northwest
- Argyle No. 1, Saskatchewan - northeast
- Bottineau County - east
- McHenry County - southeast
- Ward County - south
- Burke County - west
Protected areas[5]
- Upper Souris National Wildlife Refuge (part)
- Upper Souris Wildlife Refuge
Lakes[5]
- Lake Darling (part)
Demographics
| Historical population | |||
|---|---|---|---|
| Census | Pop. | %± | |
| 1910 | 7,840 | — | |
| 1920 | 7,776 | −0.8% | |
| 1930 | 7,263 | −6.6% | |
| 1940 | 5,533 | −23.8% | |
| 1950 | 5,405 | −2.3% | |
| 1960 | 4,698 | −13.1% | |
| 1970 | 3,828 | −18.5% | |
| 1980 | 3,608 | −5.7% | |
| 1990 | 3,160 | −12.4% | |
| 2000 | 2,610 | −17.4% | |
| 2010 | 2,470 | −5.4% | |
| Est. 2019 | 2,327 | [8] | −5.8% |
| US Decennial Census[9] 1790-1960[10] 1900-1990[11] 1990-2000[12] 2010-2019[1] | |||
2000 census
As of the 2000 United States Census, there were 2,610 people, 1,085 households, and 748 families in the county. The population density was 2.98/sqmi (1.15/km²). There were 1,413 housing units at an average density of 1.61/sqmi (0.62/km²). The racial makeup of the county was 97.74% White, 0.23% Black or African American, 0.65% Native American, 0.46% Asian, 0.11% from other races, and 0.80% from two or more races. 0.73% of the population were Hispanic or Latino of any race. 41.8% were of Norwegian, 25.7% German and 5.6% Irish ancestry.
There were 1,085 households out of which 28.70% had children under the age of 18 living with them, 60.40% were married couples living together, 5.60% had a female householder with no husband present, and 31.00% were non-families. 28.50% of all households were made up of individuals and 14.70% had someone living alone who was 65 years of age or older. The average household size was 2.35 and the average family size was 2.90.
The county population contained 23.30% under the age of 18, 4.90% from 18 to 24, 24.40% from 25 to 44, 25.30% from 45 to 64, and 22.00% who were 65 years of age or older. The median age was 44 years. For every 100 females there were 100.30 males. For every 100 females age 18 and over, there were 101.70 males.
The median income for a household in the county was $30,746, and the median income for a family was $36,023. Males had a median income of $25,346 versus $16,700 for females. The per capita income for the county was $16,478. About 8.50% of families and 11.00% of the population were below the poverty line, including 14.10% of those under age 18 and 9.10% of those age 65 or over.
2010 census
As of the 2010 United States Census, there were 2,470 people, 1,061 households, and 685 families in the county.[13] The population density was 2.82/sqmi (1.09/km²). There were 1,386 housing units at an average density of 1.58/sqmi (0.61/km²).[14] The racial makeup of the county was 97.9% white, 0.4% American Indian, 0.2% Asian, 0.1% black or African American, 0.2% from other races, and 1.2% from two or more races. Those of Hispanic or Latino origin made up 1.0% of the population.[13] In terms of ancestry, 39.5% were German, 39.1% were Norwegian, 11.6% were Irish, 9.7% were English, 9.5% were Swedish, and 2.3% were American.[15]
Of the 1,061 households, 25.8% had children under the age of 18 living with them, 56.7% were married couples living together, 5.1% had a female householder with no husband present, 35.4% were non-families, and 30.9% of all households were made up of individuals. The average household size was 2.28 and the average family size was 2.85. The median age was 45.4 years.[13]
The median income for a household in the county was $49,583 and the median income for a family was $63,068. Males had a median income of $39,950 versus $25,469 for females. The per capita income for the county was $26,856. About 3.8% of families and 5.9% of the population were below the poverty line, including 5.9% of those under age 18 and 9.6% of those age 65 or over.[16]
Communities
Townships
- Brandon
- Callahan
- Clay
- Colquhoun
- Eden Valley
- Ensign
- Fairbanks
- Grassland
- Grover
- Hamerly
- Hamlet
- Hurley
- Ivanhoe
- Lockwood
- McKinney
- Muskego
- Plain
- Prescott
- Prosperity
- Rockford
- Roosevelt
- Stafford
- Van Buren
- White Ash
Politics
Renville County voters have voted Republican in every national election since 1976 (as of 2016).
| Year | Republican | Democratic | Third parties |
|---|---|---|---|
| 2016 | 76.8% 993 | 15.6% 201 | 7.7% 99 |
| 2012 | 66.6% 851 | 31.1% 398 | 2.3% 29 |
| 2008 | 59.4% 799 | 37.5% 505 | 3.1% 42 |
| 2004 | 64.9% 953 | 33.8% 497 | 1.3% 19 |
| 2000 | 61.6% 820 | 33.3% 443 | 5.2% 69 |
| 1996 | 42.5% 576 | 41.5% 562 | 16.0% 216 |
| 1992 | 39.2% 655 | 34.7% 580 | 26.1% 435 |
| 1988 | 51.0% 893 | 47.8% 837 | 1.1% 20 |
| 1984 | 65.6% 1,163 | 33.4% 592 | 1.1% 19 |
| 1980 | 62.7% 1,154 | 30.9% 570 | 6.4% 118 |
| 1976 | 44.0% 812 | 54.6% 1,008 | 1.4% 26 |
| 1972 | 61.1% 1,121 | 38.3% 702 | 0.7% 12 |
| 1968 | 46.9% 851 | 48.5% 880 | 4.7% 85 |
| 1964 | 32.1% 640 | 67.9% 1,356 | 0.1% 1 |
| 1960 | 45.4% 1,012 | 54.6% 1,217 | 0.0% 1 |
| 1956 | 50.2% 1,035 | 49.7% 1,025 | 0.1% 1 |
| 1952 | 66.6% 1,571 | 32.5% 767 | 0.9% 22 |
| 1948 | 46.6% 812 | 48.1% 838 | 5.3% 92 |
| 1944 | 48.3% 1,046 | 50.6% 1,095 | 1.1% 23 |
| 1940 | 47.0% 1,202 | 50.8% 1,298 | 2.2% 56 |
| 1936 | 21.4% 611 | 61.7% 1,766 | 16.9% 484 |
| 1932 | 25.2% 689 | 72.1% 1,969 | 2.7% 73 |
| 1928 | 55.1% 1,473 | 43.9% 1,174 | 1.0% 27 |
| 1924 | 32.2% 649 | 6.0% 120 | 61.9% 1,248 |
| 1920 | 73.7% 1,987 | 21.5% 581 | 4.8% 130 |
| 1916 | 31.5% 532 | 60.0% 1,012 | 8.5% 143 |
| 1912 | 17.6% 224 | 33.0% 420 | 49.5% 630[20] |
References
- "State & County QuickFacts". United States Census Bureau. Retrieved November 1, 2013.
- "Find a County". National Association of Counties. Retrieved June 7, 2011.
- "Dakota Territory, South Dakota, and North Dakota: Individual County Chronologies". Dakota Territory Atlas of Historical County Boundaries. The Newberry Library. 2006. Retrieved February 4, 2015.
- "County History". Official Portal for North Dakota State Government. Archived from the original on February 2, 2015. Retrieved May 4, 2011.
- Renville County ND Google Maps (accessed February 25, 2019)
- ""Find an Altitude/Renville County ND" Google Maps (accessed February 25, 2019)". Archived from the original on May 21, 2019. Retrieved February 25, 2019.
- "2010 Census Gazetteer Files". US Census Bureau. August 22, 2012. Archived from the original on January 29, 2015. Retrieved February 1, 2015.
- "Population and Housing Unit Estimates". Retrieved April 6, 2020.
- "US Decennial Census". US Census Bureau. Retrieved February 1, 2015.
- "Historical Census Browser". University of Virginia Library. Retrieved February 1, 2015.
- Forstall, Richard L., ed. (April 20, 1995). "Population of Counties by Decennial Census: 1900 to 1990". US Census Bureau. Retrieved February 1, 2015.
- "Census 2000 PHC-T-4. Ranking Tables for Counties: 1990 and 2000" (PDF). US Census Bureau. April 2, 2001. Retrieved February 1, 2015.
- "Profile of General Population and Housing Characteristics: 2010 Demographic Profile Data". US Census Bureau. Archived from the original on February 13, 2020. Retrieved April 3, 2016.
- "Population, Housing Units, Area, and Density: 2010 - County". US Census Bureau. Archived from the original on February 13, 2020. Retrieved April 3, 2016.
- "Selected Social Characteristics in the US – 2006-2010 American Community Survey 5-Year Estimates". US Census Bureau. Archived from the original on February 13, 2020. Retrieved April 3, 2016.
- "DP03 SELECTED ECONOMIC CHARACTERISTICS – 2006-2010 American Community Survey 5-Year Estimates". US Census Bureau. Archived from the original on February 13, 2020. Retrieved April 3, 2016.
- Greene, shown on a 1977 USGS map (at present day 46th Ave NW and 86th Street NW), was a station stop on the Minneapolis, St. Paul and Sault Ste. Marie Railroad. Its former streets are still shown on Google Earth and Yahoo! Maps
- "Greene, N. Dak". www.thomasgloger.com. Archived from the original on March 4, 2016. Retrieved April 13, 2018.
- Leip, David. "Atlas of US Presidential Elections". uselectionatlas.org. Retrieved April 13, 2018.
- The leading "other" candidate, Progressive Theodore Roosevelt, received 341 votes, while Socialist Eugene Debs received 224 votes, Prohibition candidate Eugene Chafin received 17 votes.
External links
- Renville County official website
- Renville County North Dakota History website
- Renville County maps, Sheet 1 (northern) and Sheet 2 (southern), North Dakota DOT
Places adjacent to Renville County, North Dakota | ||||||||||
|---|---|---|---|---|---|---|---|---|---|---|
| ||||||||||
Municipalities and communities of Renville County, North Dakota, United States | ||
|---|---|---|
| Cities | Map of North Dakota highlighting Renville County | |
| Townships |
| |
| Unincorporated communities |
| |

| Authority control |
|
|---|