Nelson County, North Dakota
Nelson County is a county in the U.S. state of North Dakota. As of the 2010 United States Census, the population was 3,126.[1] Its county seat is Lakota.[2]
Nelson County | |
|---|---|
 Water Tower behind Lakota City Hall. | |
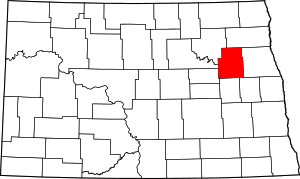 Location within the U.S. state of North Dakota | |
 North Dakota's location within the U.S. | |
| Coordinates: 47°55′N 98°11′W | |
| Country | |
| State | |
| Founded | March 2, 1883 (created) June 9, 1883 (organized) |
| Seat | Lakota |
| Largest city | Lakota |
| Area | |
| • Total | 1,009 sq mi (2,610 km2) |
| • Land | 982 sq mi (2,540 km2) |
| • Water | 27 sq mi (70 km2) 2.7% |
| Population (2010) | |
| • Total | 3,126 |
| • Estimate (2019) | 2,879 |
| • Density | 3.1/sq mi (1.2/km2) |
| Time zone | UTC−6 (Central) |
| • Summer (DST) | UTC−5 (CDT) |
| Congressional district | At-large |
| Website | www |
History
The Dakota Territory legislature created Nelson County on March 2, 1883, with areas annexed from Foster, Grand Forks and Ramsey counties, and with some previously unorganized area. It was not organized at that time, but was attached to Grand Forks County for administrative and judicial purposes. Its proposed boundary was enlarged on March 9, 1883, and on June 9, 1883 the county organization was effected and the administrative attachment to Grand Forks County was terminated.[3][4]
Geography
The county terrain consists of rolling hills dotted with lakes and ponds. The area is largely devoted to agriculture.[5] The terrain slopes to the south and east, with its highest point near the midpoint of its north boundary line, at 1,545' (471m) ASL.[6] The county has a total area of 1,009 square miles (2,610 km2), of which 982 square miles (2,540 km2) is land and 27 square miles (70 km2) (2.7%) is water.[7]
Major highways


Adjacent counties
- Walsh County - northeast
- Grand Forks County - east
- Steele County - southeast
- Griggs County - south
- Eddy County - southwest
- Benson County - west
- Ramsey County - northwest
National protected areas
Lakes[5]
- Bitter Lake
- Church Lake
- Hillesland Lake
- Johnson Lake
- Lake Laretta
- Mannie Lake
- Omild Slough
- Ottofy Lake
- Rose Lake
- Rugh Lake
- Stump Lake
- Swan Lake
Demographics
| Historical population | |||
|---|---|---|---|
| Census | Pop. | %± | |
| 1890 | 4,293 | — | |
| 1900 | 7,316 | 70.4% | |
| 1910 | 10,140 | 38.6% | |
| 1920 | 10,362 | 2.2% | |
| 1930 | 10,203 | −1.5% | |
| 1940 | 9,129 | −10.5% | |
| 1950 | 8,090 | −11.4% | |
| 1960 | 7,034 | −13.1% | |
| 1970 | 5,776 | −17.9% | |
| 1980 | 5,233 | −9.4% | |
| 1990 | 4,410 | −15.7% | |
| 2000 | 3,715 | −15.8% | |
| 2010 | 3,126 | −15.9% | |
| Est. 2019 | 2,879 | [8] | −7.9% |
| US Decennial Census[9] 1790-1960[10] 1900-1990[11] 1990-2000[12] 2010-2019[1] | |||
2000 census
As of the 2000 United States Census, there were 3,715 people, 1,628 households, and 1,004 families in the county. The population density was 3.78/sqmi (1.46/km²). There were 2,014 housing units at an average density of 2.05/sqmi (0.79/km²). The racial makeup of the county was 98.57% White, 0.08% Black or African American, 0.35% Native American, 0.30% Asian, 0.11% from other races, and 0.59% from two or more races. 0.16% of the population were Hispanic or Latino of any race. 53.4% were of Norwegian and 21.8% German ancestry.
There were 1,628 households out of which 24.20% had children under the age of 18 living with them, 53.80% were married couples living together, 5.20% had a female householder with no husband present, and 38.30% were non-families. 36.30% of all households were made up of individuals and 21.90% had someone living alone who was 65 years of age or older. The average household size was 2.18 and the average family size was 2.84.
The county population contained 22.10% under the age of 18, 4.00% from 18 to 24, 20.30% from 25 to 44, 26.20% from 45 to 64, and 27.40% who were 65 years of age or older. The median age was 47 years. For every 100 females there were 95.80 males. For every 100 females age 18 and over, there were 93.60 males.
The median income for a household in the county was $28,892, and the median income for a family was $37,406. Males had a median income of $27,163 versus $18,857 for females. The per capita income for the county was $16,320. About 7.20% of families and 10.30% of the population were below the poverty line, including 11.00% of those under age 18 and 10.30% of those age 65 or over.
2010 census
As of the 2010 United States Census, there were 3,126 people, 1,474 households, and 905 families in the county.[13] The population density was 3.18/sqmi (1.23/km²). There were 1,927 housing units at an average density of 1.96/sqmi (0.76/km²).[14] The racial makeup of the county was 97.2% white, 1.0% American Indian, 0.3% black or African American, 0.1% Asian, 0.0% from other races, and 1.5% from two or more races. Those of Hispanic or Latino origin made up 1.1% of the population.[13] In terms of ancestry, 52.3% were Norwegian, 34.1% were German, 8.2% were Irish, and 3.9% were American.[15]
Of the 1,474 households, 21.4% had children under the age of 18 living with them, 52.1% were married couples living together, 5.4% had a female householder with no husband present, 38.6% were non-families, and 36.0% of all households were made up of individuals. The average household size was 2.07 and the average family size was 2.66. The median age was 51.5 years.[13]
The median income for a household in the county was $39,071 and the median income for a family was $51,731. Males had a median income of $33,629 versus $28,672 for females. The per capita income for the county was $22,838. About 4.0% of families and 9.9% of the population were below the poverty line, including 14.0% of those under age 18 and 13.6% of those age 65 or over.[16]
Communities
Cities
- Aneta
- Lakota (county seat)
- McVille
- Michigan City
- Pekin
- Petersburg
- Tolna
Census-designated place
Townships
- Adler
- Bergen
- Central
- Clara
- Dahlen
- Dayton
- Dodds
- Enterprise
- Field
- Forde
- Hamlin
- Illinois
- Lakota
- Lee
- Leval
- Melvin
- Michigan
- Nash
- Nesheim
- Ora
- Osago
- Petersburg
- Rubin
- Rugh
- Sarnia
- Wamduska
- Williams
| Range 61 | Range 60 | Range 59 | Range 58 | Range 57 | |
|---|---|---|---|---|---|
| Township 154 | Clara | Enterprise | Sarnia | Dahlen | |
| Township 153 | Lakota | Rubin | Michigan | Nash | |
| Township 152 | Illinois | Dodds | Williams | Michigan | Petersburg |
| Township 151 | Leval | Wamduska | Central | Melvin | Adler |
| Township 150 | Dayton | Osago | Hamlin | Field | Rugh |
| Township 149 | Forde | Bergen | Nesheim | Lee | Ora |
Politics
Nelson County voters have slightly favored Republicans for the past several decades. Since 1964 the county selected the Republican Party candidate in 64% of national elections.
| Year | Republican | Democratic | Third parties |
|---|---|---|---|
| 2016 | 59.7% 1,025 | 31.2% 536 | 9.1% 156 |
| 2012 | 51.6% 865 | 45.7% 767 | 2.7% 46 |
| 2008 | 45.7% 800 | 51.8% 907 | 2.6% 45 |
| 2004 | 57.6% 1,107 | 40.5% 778 | 1.9% 37 |
| 2000 | 56.0% 1,031 | 37.3% 687 | 6.6% 122 |
| 1996 | 41.4% 745 | 46.0% 827 | 12.6% 227 |
| 1992 | 39.2% 864 | 38.1% 841 | 22.7% 501 |
| 1988 | 48.1% 1,078 | 51.3% 1,151 | 0.6% 14 |
| 1984 | 57.5% 1,445 | 40.8% 1,026 | 1.7% 42 |
| 1980 | 62.1% 1,611 | 28.0% 726 | 9.9% 258 |
| 1976 | 44.3% 1,336 | 53.4% 1,610 | 2.3% 69 |
| 1972 | 53.7% 1,625 | 44.9% 1,358 | 1.5% 45 |
| 1968 | 48.3% 1,526 | 46.7% 1,477 | 5.0% 159 |
| 1964 | 33.5% 1,101 | 66.5% 2,186 | |
| 1960 | 52.0% 1,934 | 47.9% 1,783 | 0.1% 2 |
| 1956 | 50.4% 1,821 | 49.6% 1,794 | 0.1% 2 |
| 1952 | 63.0% 2,443 | 36.6% 1,418 | 0.5% 19 |
| 1948 | 47.3% 1,672 | 46.0% 1,629 | 6.7% 237 |
| 1944 | 43.8% 1,506 | 55.9% 1,925 | 0.3% 10 |
| 1940 | 43.1% 1,859 | 56.4% 2,435 | 0.5% 22 |
| 1936 | 22.3% 1,002 | 65.8% 2,954 | 11.9% 535 |
| 1932 | 23.1% 956 | 76.9% 3,176 | |
| 1928 | 60.2% 2,364 | 39.3% 1,542 | 0.6% 22 |
| 1924 | 49.2% 1,697 | 5.1% 175 | 45.7% 1,577 |
| 1920 | 84.5% 3,127 | 13.5% 501 | 2.0% 73 |
| 1916 | 51.0% 1,013 | 43.3% 861 | 5.7% 113 |
| 1912 | 26.3% 448 | 30.9% 526 | 42.7% 727[19] |
| 1908 | 63.8% 1,225 | 32.1% 616 | 4.1% 79 |
| 1904 | 74.6% 1,284 | 19.8% 340 | 5.6% 97 |
| 1900 | 61.2% 994 | 35.5% 576 | 3.3% 53 |
References
- "State & County QuickFacts". United States Census Bureau. Archived from the original on June 7, 2011. Retrieved November 1, 2013.
- "Find a County". National Association of Counties. Retrieved June 7, 2011.
- "Dakota Territory, South Dakota, and North Dakota: Individual County Chronologies". Dakota Territory Atlas of Historical County Boundaries. The Newberry Library. 2006. Retrieved February 3, 2015.
- "County History". North Dakota.gov. The State of North Dakota. Archived from the original on February 2, 2015. Retrieved February 3, 2015.
- Nelson County ND Google Maps (accessed 25 February 2019)
- ""Find an Altitude/Nelson County ND" Google Maps (accessed 25 February 2019)". Archived from the original on May 21, 2019. Retrieved February 26, 2019.
- "2010 Census Gazetteer Files". US Census Bureau. August 22, 2012. Archived from the original on January 29, 2015. Retrieved February 1, 2015.
- "Population and Housing Unit Estimates". Retrieved April 3, 2020.
- "US Decennial Census". US Census Bureau. Retrieved February 1, 2015.
- "Historical Census Browser". University of Virginia Library. Retrieved February 1, 2015.
- Forstall, Richard L., ed. (April 20, 1995). "Population of Counties by Decennial Census: 1900 to 1990". US Census Bureau. Retrieved February 1, 2015.
- "Census 2000 PHC-T-4. Ranking Tables for Counties: 1990 and 2000" (PDF). US Census Bureau. April 2, 2001. Retrieved February 1, 2015.
- "Profile of General Population and Housing Characteristics: 2010 Demographic Profile Data". US Census Bureau. Archived from the original on February 13, 2020. Retrieved March 14, 2016.
- "Population, Housing Units, Area, and Density: 2010 - County". US Census Bureau. Archived from the original on February 13, 2020. Retrieved March 14, 2016.
- "Selected Social Characteristics in the US – 2006-2010 American Community Survey 5-Year Estimates". US Census Bureau. Archived from the original on February 13, 2020. Retrieved March 14, 2016.
- "Selected Economic Characteristics – 2006-2010 American Community Survey 5-Year Estimates". US Census Bureau. Archived from the original on February 13, 2020. Retrieved March 14, 2016.
- "Earth Point".
- Leip, David. "Atlas of US Presidential Elections". uselectionatlas.org. Retrieved April 13, 2018.
- The leading "other" candidate, Progressive Theodore Roosevelt, received 511 votes, while Socialist Eugene Debs received 178 votes, Prohibition candidate Eugene Chafin received 38 votes.
External links
- Nelson County map, North Dakota DOT
Places adjacent to Nelson County, North Dakota | ||||||||||
|---|---|---|---|---|---|---|---|---|---|---|
| ||||||||||
Municipalities and communities of Nelson County, North Dakota, United States | ||
|---|---|---|
| Cities | Map of North Dakota highlighting Nelson County | |
| Townships |
| |
| CDP | ||
| Unincorporated communities | ||

| Authority control |
|
|---|