Oliver County, North Dakota
Oliver County is a county located in the U.S. state of North Dakota. As of the 2010 census, the population was 1,846,[1] making it the fifth-least populous county in North Dakota. Its county seat and only city is Center.[2]
Oliver County | |
|---|---|
.jpg) | |
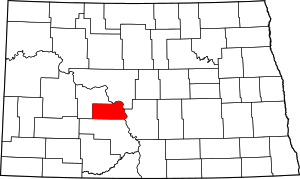 Location within the U.S. state of North Dakota | |
 North Dakota's location within the U.S. | |
| Coordinates: 47°07′N 101°21′W | |
| Country | |
| State | |
| Founded | April 14, 1885 (created) May 18, 1885 (organized) |
| Named for | Harry S. Oliver |
| Seat | Center |
| Largest city | Center |
| Area | |
| • Total | 731 sq mi (1,890 km2) |
| • Land | 723 sq mi (1,870 km2) |
| • Water | 8.7 sq mi (23 km2) 1.2% |
| Population (2010) | |
| • Total | 1,846 |
| • Estimate (2019) | 1,959 |
| • Density | 2.5/sq mi (0.98/km2) |
| Time zone | UTC−6 (Central) |
| • Summer (DST) | UTC−5 (CDT) |
| Congressional district | At-large |
History
The Dakota Territory legislature created the county on April 14, 1885, with territory partitioned from Mercer County. It was named for Harry S. Oliver of Lisbon, North Dakota (1855-1909), a Republican politician and member of the Dakota Territory House of Representatives at the time. The county government was organized on 18 May, with Sanger (then known as "Bentley") as county seat. The seat was moved to Center in 1902.[3][4]
Oliver County is included in the Bismarck, ND Metropolitan Statistical Area.
Geography
The northeastern/eastern boundary of Oliver County is delineated by the Missouri River as it flows southeastward after leaving Lake Sakakawea. The county terrain consists of rolling hills, mostly devoted to agriculture.[5] The terrain slopes to the east, with the highest point a hill near its SW corner, at 2,382' (726m) ASL.[6] The county has a total area of 731 square miles (1,890 km2), of which 723 square miles (1,870 km2) is land and 8.7 square miles (23 km2) (1.2%) is water.[7] It is the fifth-smallest county in North Dakota by area.
Major highways


Adjacent counties
- McLean County - northeast
- Burleigh County - east
- Morton County - south
- Mercer County - northwest
Protected areas[5]
- Cross Ranch State Park
Lakes[5]
- Mandan Lake
- Nelson Lake
Demographics
| Historical population | |||
|---|---|---|---|
| Census | Pop. | %± | |
| 1890 | 464 | — | |
| 1900 | 990 | 113.4% | |
| 1910 | 3,577 | 261.3% | |
| 1920 | 4,425 | 23.7% | |
| 1930 | 4,262 | −3.7% | |
| 1940 | 3,859 | −9.5% | |
| 1950 | 3,091 | −19.9% | |
| 1960 | 2,610 | −15.6% | |
| 1970 | 2,322 | −11.0% | |
| 1980 | 2,495 | 7.5% | |
| 1990 | 2,381 | −4.6% | |
| 2000 | 2,065 | −13.3% | |
| 2010 | 1,846 | −10.6% | |
| Est. 2019 | 1,959 | [8] | 6.1% |
| US Decennial Census[9] 1790-1960[10] 1900-1990[11] 1990-2000[12] 2010-2019[1] | |||
2000 census
As of the 2000 United States Census, there were 2,065 people, 791 households, and 604 families in the county. The population density was 2.86/sqmi (1.10/km²). There were 903 housing units at an average density of 1.25/sqmi (0.48/km²). The racial makeup of the county was 97.58% White, 0.15% Black or African American, 1.26% Native American, 0.10% Asian, and 0.92% from two or more races. 0.63% of the population were Hispanic or Latino of any race. 59.2% were of German, 13.6% Norwegian and 6.5% American ancestry.
There were 791 households out of which 35.50% had children under the age of 18 living with them, 69.20% were married couples living together, 3.90% had a female householder with no husband present, and 23.60% were non-families. 21.00% of all households were made up of individuals and 10.70% had someone living alone who was 65 years of age or older. The average household size was 2.61 and the average family size was 3.05.
The county population contained 27.40% under the age of 18, 4.70% from 18 to 24, 23.50% from 25 to 44, 30.10% from 45 to 64, and 14.20% who were 65 years of age or older. The median age was 42 years. For every 100 females there were 107.50 males. For every 100 females age 18 and over, there were 106.20 males.
The median income for a household in the county was $36,650, and the median income for a family was $45,430. Males had a median income of $40,577 versus $19,015 for females. The per capita income for the county was $16,271. About 11.20% of families and 14.90% of the population were below the poverty line, including 23.60% of those under age 18 and 13.90% of those age 65 or over.
2010 census
As of the 2010 United States Census, there were 1,846 people, 756 households, and 554 families in the county.[13] The population density was 2.55/sqmi (0.99/km²). There were 905 housing units at an average density of 1.25/sqmi (0.48/km²).[14] The racial makeup of the county was 97.3% white, 1.5% American Indian, 0.2% black or African American, 0.2% Asian, 0.2% from other races, and 0.7% from two or more races. Those of Hispanic or Latino origin made up 1.0% of the population.[13] In terms of ancestry, 66.8% were German, 19.3% were Norwegian, 7.6% were Russian, 6.3% were English, and 4.4% were American.[15]
Of the 756 households, 25.0% had children under the age of 18 living with them, 65.5% were married couples living together, 4.8% had a female householder with no husband present, 26.7% were non-families, and 22.6% of all households were made up of individuals. The average household size was 2.44 and the average family size was 2.84. The median age was 47.6 years.[13]
The median income for a household in the county was $62,308 and the median income for a family was $75,069. Males had a median income of $60,592 versus $28,409 for females. The per capita income for the county was $29,348. About 6.5% of families and 9.7% of the population were below the poverty line, including 13.0% of those under age 18 and 19.6% of those age 65 or over.[16]
Communities
City
- Center (county seat)
Politics
Oliver County voters are traditionally Republican. In only one national election since 1936 has the county selected the Democratic Party candidate (as of 2016).
| Year | Republican | Democratic | Third parties |
|---|---|---|---|
| 2016 | 81.6% 830 | 11.7% 119 | 6.7% 68 |
| 2012 | 68.4% 693 | 27.7% 281 | 3.9% 39 |
| 2008 | 65.6% 682 | 31.9% 332 | 2.5% 26 |
| 2004 | 70.6% 790 | 27.7% 310 | 1.7% 19 |
| 2000 | 67.5% 709 | 23.2% 244 | 9.3% 98 |
| 1996 | 48.8% 499 | 32.6% 333 | 18.6% 190 |
| 1992 | 41.0% 503 | 24.9% 306 | 34.1% 419 |
| 1988 | 56.3% 696 | 42.5% 526 | 1.2% 15 |
| 1984 | 67.4% 915 | 30.9% 419 | 1.7% 23 |
| 1980 | 73.4% 966 | 20.5% 270 | 6.1% 80 |
| 1976 | 50.4% 575 | 46.4% 529 | 3.2% 36 |
| 1972 | 65.1% 669 | 28.5% 293 | 6.3% 65 |
| 1968 | 63.4% 616 | 27.7% 269 | 8.9% 86 |
| 1964 | 46.1% 469 | 53.9% 548 | |
| 1960 | 58.7% 703 | 41.2% 494 | 0.1% 1 |
| 1956 | 73.0% 788 | 25.9% 279 | 1.1% 12 |
| 1952 | 87.8% 1,132 | 11.1% 143 | 1.1% 14 |
| 1948 | 67.8% 749 | 27.5% 304 | 4.6% 51 |
| 1944 | 76.8% 756 | 22.3% 219 | 0.9% 9 |
| 1940 | 83.6% 1,356 | 16.4% 266 | 0.1% 1 |
| 1936 | 29.8% 469 | 57.6% 906 | 12.6% 198 |
| 1932 | 20.6% 302 | 78.4% 1,152 | 1.0% 15 |
| 1928 | 51.7% 680 | 48.0% 631 | 0.4% 5 |
| 1924 | 32.2% 367 | 2.7% 31 | 65.1% 743 |
| 1920 | 85.9% 1,105 | 8.6% 111 | 5.5% 71 |
| 1916 | 47.8% 346 | 45.2% 327 | 7.0% 51 |
| 1912 | 22.7% 131 | 24.1% 139 | 53.3% 308 |
| 1908 | 62.5% 325 | 34.4% 179 | 3.1% 16 |
| 1904 | 81.4% 241 | 15.5% 46 | 3.0% 9 |
| 1900 | 58.8% 110 | 40.1% 75 | 1.1% 2 |
References
- "State & County QuickFacts". United States Census Bureau. Archived from the original on June 7, 2011. Retrieved November 1, 2013.
- "Find a County". National Association of Counties. Retrieved June 7, 2011.
- "Dakota Territory, South Dakota, and North Dakota: Individual County Chronologies". Dakota Territory Atlas of Historical County Boundaries. The Newberry Library. 2006. Retrieved February 3, 2015.
- "County History". Official Portal for North Dakota State Government. Archived from the original on November 16, 2018. Retrieved May 4, 2011.
- Oliver County ND Google Maps (accessed February 26, 2019)
- ""Find an Altitude/Oliver County ND" Google Maps (accessed February 26, 2019)". Archived from the original on May 21, 2019. Retrieved February 27, 2019.
- "2010 Census Gazetteer Files". US Census Bureau. August 22, 2012. Archived from the original on January 29, 2015. Retrieved February 1, 2015.
- "Population and Housing Unit Estimates". Retrieved April 6, 2020.
- "US Decennial Census". US Census Bureau. Retrieved February 1, 2015.
- "Historical Census Browser". University of Virginia Library. Retrieved February 1, 2015.
- Forstall, Richard L., ed. (April 20, 1995). "Population of Counties by Decennial Census: 1900 to 1990". US Census Bureau. Retrieved February 1, 2015.
- "Census 2000 PHC-T-4. Ranking Tables for Counties: 1990 and 2000" (PDF). US Census Bureau. April 2, 2001. Retrieved February 1, 2015.
- "Profile of General Population and Housing Characteristics: 2010 Demographic Profile Data". US Census Bureau. Archived from the original on February 13, 2020. Retrieved March 14, 2016.
- "Population, Housing Units, Area, and Density: 2010 - County". US Census Bureau. Archived from the original on February 13, 2020. Retrieved March 14, 2016.
- "Selected Social Characteristics in the US – 2006-2010 American Community Survey 5-Year Estimates". US Census Bureau. Archived from the original on February 13, 2020. Retrieved March 14, 2016.
- "Selected Economic Characteristics". US Census Bureau. Archived from the original on February 13, 2020. Retrieved March 14, 2016.
- Leip, David. "Atlas of US Presidential Elections". uselectionatlas.org. Retrieved April 13, 2018.
External links
- Oliver County map, North Dakota DOT
Places adjacent to Oliver County, North Dakota | ||||||||||
|---|---|---|---|---|---|---|---|---|---|---|
| ||||||||||
Municipalities and communities of Oliver County, North Dakota, United States | ||
|---|---|---|
| City | Map of North Dakota highlighting Oliver County | |
| Unorganized territories |
| |
| Unincorporated communities | ||

| Counties |  | |
|---|---|---|
| Core cities | ||
| Surrounding areas |
| |
| Authority control |
|
|---|