Griggs County, North Dakota
Griggs County is a county in the U.S. state of North Dakota. As of the 2010 United States Census, the population was 2,420.[1] Its county seat is Cooperstown.[2]
Griggs County | |
|---|---|
.jpg) Griggs County Courthouse. Photographed in 1892. | |
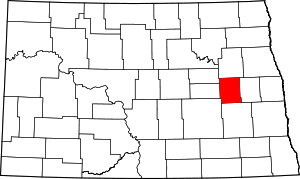 Location within the U.S. state of North Dakota | |
 North Dakota's location within the U.S. | |
| Coordinates: 47°28′N 98°14′W | |
| Country | |
| State | |
| Founded | February 18, 1881 (created) June 16, 1882 (organized) |
| Seat | Cooperstown |
| Largest city | Cooperstown |
| Area | |
| • Total | 716 sq mi (1,850 km2) |
| • Land | 709 sq mi (1,840 km2) |
| • Water | 7.6 sq mi (20 km2) 1.1% |
| Population (2010) | |
| • Total | 2,420 |
| • Estimate (2019) | 2,231 |
| • Density | 3.4/sq mi (1.3/km2) |
| Time zone | UTC−6 (Central) |
| • Summer (DST) | UTC−5 (CDT) |
| Congressional district | At-large |
| Website | www |
History
The county was created by the Dakota Territory legislature on February 18, 1881, with territories partitioned from Barnes, Foster, and Traill counties. It was not organized at that time, nor was it attached to another county for administrative or judicial purposes. It was named for Alexander Griggs, a steamboat captain who is credited with founding Grand Forks.[3]
The county organization was effected on June 16, 1882. Its boundary was altered in 1883 when Steele County was partitioned off; it has retained its present boundary since then.[4][5]
Geography
The Sheyenne River flows southward through the east-central part of Griggs County, discharging into Lake Ashtabula at the county's SE corner. The county terrain consists of low rolling hills, dotted with lakes and ponds across its central part, mostly devoted to agriculture.[6] The terrain slopes to the south and east; its highest point is a hill at its NW corner, at 1,562' (476m) ASL.[7] The county has a total area of 716 square miles (1,850 km2), of which 709 square miles (1,840 km2) is land and 7.6 square miles (20 km2) (1.1%) is water.[8] It is the third-smallest county in North Dakota by land area and fourth-smallest by total area.
Major highways
Adjacent counties
- Nelson County (north)
- Steele County (east)
- Barnes County (south)
- Stutsman County (southwest)
- Foster County (west)
- Eddy County (northwest)
National protected area
Lakes[6]
- Hoot-E-Too Lake
- Jones Lake
- Lake Addie
- Lake Ashtabula (part)
- Lake Five
- Lake Jessie
- Lake Norway
- Lake Silver
- Long Lake
- Phelps Lake
- Pickerel Lake (part)
- Plum Lake
- Red Willow Lake
- Round Lake
- Rush Lake
- Sibley Lake
Demographics
| Historical population | |||
|---|---|---|---|
| Census | Pop. | %± | |
| 1890 | 2,817 | — | |
| 1900 | 4,744 | 68.4% | |
| 1910 | 6,274 | 32.3% | |
| 1920 | 7,402 | 18.0% | |
| 1930 | 6,889 | −6.9% | |
| 1940 | 5,818 | −15.5% | |
| 1950 | 5,460 | −6.2% | |
| 1960 | 5,023 | −8.0% | |
| 1970 | 4,184 | −16.7% | |
| 1980 | 3,714 | −11.2% | |
| 1990 | 3,303 | −11.1% | |
| 2000 | 2,754 | −16.6% | |
| 2010 | 2,420 | −12.1% | |
| Est. 2019 | 2,231 | [9] | −7.8% |
| US Decennial Census[10] 1790-1960[11] 1900-1990[12] 1990-2000[13] 2010-2019[1] | |||
2000 census
As of the 2000 United States Census, there were 2,754 people, 1,178 households, and 781 families in the county. The population density was 4 people per square mile (2/km²). There were 1,521 housing units at an average density of 2 per square mile (1/km²). The racial makeup of the county was 99.31% White, 0.22% Native American, 0.15% Asian, 0.15% from other races, and 0.18% from two or more races. 0.40% of the population were Hispanic or Latino of any race. 59.7% were of Norwegian and 24.9% German ancestry.
There were 1,178 households out of which 26.70% had children under the age of 18 living with them, 59.30% were married couples living together, 4.70% had a female householder with no husband present, and 33.70% were non-families. 31.60% of all households were made up of individuals and 18.60% had someone living alone who was 65 years of age or older. The average household size was 2.29 and the average family size was 2.88.
The county population contained 22.50% under the age of 18, 4.90% from 18 to 24, 21.10% from 25 to 44, 25.80% from 45 to 64, and 25.70% who were 65 years of age or older. The median age was 46 years. For every 100 females there were 99.40 males. For every 100 females age 18 and over, there were 99.90 males.
The median income for a household in the county was $29,572, and the median income for a family was $38,611. Males had a median income of $26,981 versus $19,327 for females. The per capita income for the county was $16,131. About 7.80% of families and 10.10% of the population were below the poverty line, including 10.00% of those under age 18 and 10.30% of those age 65 or over.
2010 census
As of the 2010 United States Census, there were 2,420 people, 1,131 households, and 694 families in the county.[14] The population density was 3.4 inhabitants per square mile (1.3/km2). There were 1,461 housing units at an average density of 2.1 per square mile (0.81/km2).[15] The racial makeup of the county was 98.8% white, 0.3% American Indian, 0.3% black or African American, 0.2% Asian, 0.2% from other races, and 0.2% from two or more races. Those of Hispanic or Latino origin made up 0.4% of the population.[14] In terms of ancestry, 60.8% were Norwegian, 36.7% were German, 5.9% were English, 5.6% were Swedish, and 1.2% were American.[16]
Of the 1,131 households, 20.8% had children under the age of 18 living with them, 53.9% were married couples living together, 4.2% had a female householder with no husband present, 38.6% were non-families, and 36.3% of all households were made up of individuals. The average household size was 2.10 and the average family size was 2.70. The median age was 51.9 years.[14]
The median income for a household in the county was $40,085 and the median income for a family was $51,570. Males had a median income of $33,169 versus $27,038 for females. The per capita income for the county was $24,122. About 9.5% of families and 11.4% of the population were below the poverty line, including 11.4% of those under age 18 and 17.5% of those age 65 or over.[17]
Communities
Cities
- Cooperstown (county seat)
- Binford
- Hannaford
Unincorporated communities[6]
- Karnak
- Walum
Townships
| Range 61 | Range 60 | Range 59 | Range 58 | |
|---|---|---|---|---|
| Township 148 | Rosendal | Willow | Pilot Mound | Lenora |
| Township 147 | Bryan | Addie | Tyrol | Romness |
| Township 146 | Kingsley | Clearfield | Cooperstown | Washburn |
| Township 145 | Mabel | Helena | Ball Hill | Sverdrup |
| Township 144 | Dover | Bartley | Greenfield | Broadview |
Politics
Griggs County voters usually vote Republican. In only one national election since 1964 has the county selected the Democratic Party candidate.
| Year | Republican | Democratic | Third parties |
|---|---|---|---|
| 2016 | 67.0% 847 | 23.6% 298 | 9.5% 120 |
| 2012 | 57.4% 771 | 39.9% 536 | 2.7% 36 |
| 2008 | 51.9% 682 | 45.5% 598 | 2.6% 34 |
| 2004 | 63.0% 907 | 35.1% 505 | 1.9% 27 |
| 2000 | 62.6% 920 | 33.0% 484 | 4.4% 65 |
| 1996 | 46.5% 731 | 42.7% 670 | 10.8% 170 |
| 1992 | 44.0% 773 | 36.9% 647 | 19.1% 336 |
| 1988 | 54.1% 1,020 | 44.9% 846 | 1.0% 19 |
| 1984 | 59.9% 1,254 | 39.5% 828 | 0.6% 12 |
| 1980 | 61.8% 1,342 | 29.3% 636 | 8.9% 192 |
| 1976 | 48.0% 1,086 | 49.6% 1,122 | 2.4% 54 |
| 1972 | 58.1% 1,312 | 39.9% 901 | 2.0% 45 |
| 1968 | 49.8% 1,110 | 45.3% 1,008 | 4.9% 109 |
| 1964 | 37.0% 885 | 63.0% 1,505 | |
| 1960 | 49.9% 1,278 | 49.9% 1,279 | 0.2% 4 |
| 1956 | 50.8% 1,212 | 49.1% 1,173 | 0.1% 2 |
| 1952 | 66.2% 1,727 | 33.4% 872 | 0.4% 10 |
| 1948 | 44.3% 1,036 | 50.5% 1,180 | 5.2% 122 |
| 1944 | 44.5% 990 | 55.1% 1,228 | 0.4% 9 |
| 1940 | 43.1% 1,117 | 56.5% 1,464 | 0.4% 11 |
| 1936 | 24.5% 666 | 61.2% 1,665 | 14.4% 392 |
| 1932 | 18.0% 428 | 77.3% 1,838 | 4.7% 111 |
| 1928 | 52.5% 1,329 | 46.7% 1,182 | 0.9% 23 |
| 1924 | 33.3% 738 | 5.2% 116 | 61.4% 1,360 |
| 1920 | 73.8% 1,739 | 22.5% 530 | 3.7% 86 |
| 1916 | 40.9% 521 | 52.4% 668 | 6.8% 86 |
| 1912 | 14.5% 144 | 43.6% 434 | 41.9% 417 |
| 1908 | 51.8% 605 | 42.3% 493 | 5.9% 69 |
| 1904 | 66.8% 688 | 22.5% 232 | 10.7% 110 |
| 1900 | 54.4% 527 | 42.1% 407 | 3.5% 34 |
See also
- National Register of Historic Places listings in Griggs County, North Dakota
- USS Griggs (APA-110), U.S. Navy ship named for this county
References
- "State & County QuickFacts". United States Census Bureau. Archived from the original on June 7, 2011. Retrieved October 31, 2013.
- "Find a County". National Association of Counties. Archived from the original on May 31, 2011. Retrieved June 7, 2011.
- Gannett, Henry (1905). The Origin of Certain Place Names in the United States. Govt. Print. Off. p. 145.
- "Dakota Territory, South Dakota, and North Dakota: Individual County Chronologies". Dakota Territory Atlas of Historical County Boundaries. The Newberry Library. 2006. Retrieved February 20, 2019.
- "County History". North Dakota.gov. The State of North Dakota. Archived from the original on February 2, 2015. Retrieved February 3, 2015.
- Griggs County ND Google Maps (accessed February 20, 2019)
- ""Find an Altitude/Griggs County ND" Google Maps (accessed February 20, 2019)". Archived from the original on May 21, 2019. Retrieved February 20, 2019.
- "2010 Census Gazetteer Files". US Census Bureau. August 22, 2012. Archived from the original on January 29, 2015. Retrieved January 28, 2015.
- "Population and Housing Unit Estimates". Retrieved April 6, 2020.
- "US Decennial Census". US Census Bureau. Retrieved January 28, 2015.
- "Historical Census Browser". University of Virginia Library. Retrieved January 28, 2015.
- Forstall, Richard L., ed. (April 20, 1995). "Population of Counties by Decennial Census: 1900 to 1990". US Census Bureau. Retrieved January 28, 2015.
- "Census 2000 PHC-T-4. Ranking Tables for Counties: 1990 and 2000" (PDF). US Census Bureau. April 2, 2001. Retrieved January 28, 2015.
- "Profile of General Population and Housing Characteristics: 2010 Demographic Profile Data". US Census Bureau. Archived from the original on February 13, 2020. Retrieved March 14, 2016.
- "Population, Housing Units, Area, and Density: 2010 - County". US Census Bureau. Archived from the original on February 13, 2020. Retrieved March 14, 2016.
- "Selected Social Characteristics in the US – 2006-2010 American Community Survey 5-Year Estimates". US Census Bureau. Archived from the original on February 13, 2020. Retrieved March 14, 2016.
- "Selected Economic Characteristics – 2006-2010 American Community Survey 5-Year Estimates". US Census Bureau. Archived from the original on February 13, 2020. Retrieved March 14, 2016.
- Township Numbers - ND.gov
- Leip, David. "Atlas of US Presidential Elections". uselectionatlas.org. Retrieved April 12, 2018.
External links
- Griggs County map, North Dakota DOT
Places adjacent to Griggs County, North Dakota | ||||||||||
|---|---|---|---|---|---|---|---|---|---|---|
| ||||||||||
Municipalities and communities of Griggs County, North Dakota, United States | ||
|---|---|---|
| Cities | Map of North Dakota highlighting Griggs County | |
| Townships | ||
| CDPs | ||
| Unincorporated communities | ||

| Authority control |
|
|---|