Billings County, North Dakota
Billings County is a county in the U.S. state of North Dakota. As of the 2010 United States Census, the population was 783,[1] making it the second-least populous county in North Dakota. Its county seat and only incorporated place is Medora.[2]
Billings County | |
|---|---|
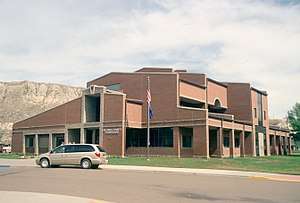 Billings County Courthouse in Medora, North Dakota | |
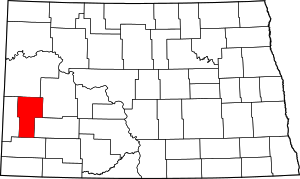 Location within the U.S. state of North Dakota | |
 North Dakota's location within the U.S. | |
| Coordinates: 47°02′N 103°22′W | |
| Country | |
| State | |
| Founded | February 10, 1879 (created) May 4, 1886 (organized) |
| Named for | Frederick H. Billings |
| Seat | Medora |
| Largest city | Medora |
| Area | |
| • Total | 1,153 sq mi (2,990 km2) |
| • Land | 1,149 sq mi (2,980 km2) |
| • Water | 4.6 sq mi (12 km2) 0.4% |
| Population (2010) | |
| • Total | 783 |
| • Estimate (2019) | 928 |
| • Density | 0.68/sq mi (0.26/km2) |
| Time zone | UTC−7 (Mountain) |
| • Summer (DST) | UTC−6 (MDT) |
| Congressional district | At-large |
| Website | www |
The Territorial legislature authorized Billings County on February 10, 1879, naming it for Northern Pacific Railway president Frederick H. Billings. It was organized on May 4, 1886. The original county boundary was significantly altered since its creation, by actions in 1883, 1885, 1887, 1896, 1901 and 1904. Its most significant alterations came in 1907 (Bowman County partitioned off), 1912 (Golden Valley County partitioned off), and 1914 (Slope County partitioned off).[3][4]
Geography
The Little Missouri River flows southward through the western portion of the county. Bullion Creek flows eastward into the SW corner of the county to discharge into the Little Missouri River.
Billings County terrain consists of rugged semi-arid hills in its western portion, giving way to more level ground in the east.[5] The terrain slopes to the east and south, with its highest terrain along its west boundary line, at 2,523' (769m) ASL.[6]
Billings County has a total area of 1,153 square miles (2,990 km2), of which 1,149 square miles (2,980 km2) is land and 4.6 square miles (12 km2) (0.4%) is water.[7] The South Unit of Theodore Roosevelt National Park lies in the central part of the county, just north of Medora.
Major highways


Adjacent counties
- McKenzie County – north
- Dunn County – northeast
- Stark County – east
- Slope County – south
- Golden Valley County – west
Protected areas
Demographics
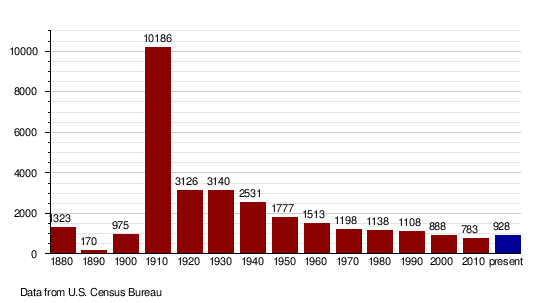
| Historical population | |||
|---|---|---|---|
| Census | Pop. | %± | |
| 1880 | 1,323 | — | |
| 1890 | 170 | −87.2% | |
| 1900 | 975 | 473.5% | |
| 1910 | 10,186 | 944.7% | |
| 1920 | 3,126 | −69.3% | |
| 1930 | 3,140 | 0.4% | |
| 1940 | 2,531 | −19.4% | |
| 1950 | 1,777 | −29.8% | |
| 1960 | 1,513 | −14.9% | |
| 1970 | 1,198 | −20.8% | |
| 1980 | 1,138 | −5.0% | |
| 1990 | 1,108 | −2.6% | |
| 2000 | 888 | −19.9% | |
| 2010 | 783 | −11.8% | |
| Est. 2019 | 928 | [9] | 18.5% |
| US Decennial Census[10] 1790-1960[11] 1900-1990[12] 1990-2000[13] 2010-2019[1] [note 1] | |||
2000 census
As of the 2000 United States Census, there were 888 people, 366 households, and 255 families in the county. The population density was 0.79 people per square mile (0.31/km²). There were 529 housing units at an average density of 0.45 per square mile (0.18/km²). The racial makeup of the county was 98.96% White, 0.11% Native American, 0.11% Pacific Islander, 0.11% from other races, and 0.70% from two or more races. 0.34% of the population were Hispanic or Latino of any race. 44.2% were of German, 17.5% Ukrainian, 8.2% Norwegian and 5.4% Irish ancestry.
There were 366 households out of which 29.2% had children under the age of 18 living with them, 62.6% were married couples living together, 4.4% had a female householder with no husband present, and 30.1% were non-families. 26.8% of all households were made up of individuals and 7.7% had someone living alone who was 65 years of age or older. The average household size was 2.43 and the average family size was 2.95.
The county population contained 24.9% under the age of 18, 4.5% from 18 to 24, 26.6% from 25 to 44, 28.0% from 45 to 64, and 16.0% who were 65 years of age or older. The median age was 42 years. For every 100 females there were 112.9 males. For every 100 females age 18 and over, there were 112.4 males.
The median income for a household in the county was $32,667, and the median income for a family was $35,750. Males had a median income of $32,500 versus $21,000 for females. The per capita income for the county was $16,186. About 10.7% of families and 12.8% of the population were below the poverty line, including 11.0% of those under age 18 and 12.8% of those age 65 or over.
2010 census
As of the 2010 census, there were 783 people, 358 households, and 223 families in the county.[14] The population density was 0.7 inhabitants per square mile (0.27/km2). There were 484 housing units at an average density of 0.4 per square mile (0.15/km2).[15] The racial makeup of the county was 98.6% white, 0.5% Asian, 0.4% American Indian, 0.3% black or African American, 0.1% from other races, and 0.1% from two or more races. Those of Hispanic or Latino origin made up 0.5% of the population.[14] In terms of ancestry, 40.6% were German, 19.1% were Ukrainian, 17.7% were Norwegian, 9.3% were Irish, 7.4% were Russian, 5.0% were English, and 0.9% were American.[16]
Of the 358 households, 19.0% had children under the age of 18 living with them, 56.1% were married couples living together, 1.7% had a female householder with no husband present, 37.7% were non-families, and 33.2% of all households were made up of individuals. The average household size was 2.16 and the average family size was 2.72. The median age was 48.6 years.[14]
The median income for a household in the county was $51,923 and the median income for a family was $61,250. Males had a median income of $46,806 versus $31,250 for females. The per capita income for the county was $28,666. About 6.8% of families and 8.3% of the population were below the poverty line, including 11.9% of those under age 18 and 4.5% of those age 65 or over.[17]
Population by decade
Politics
Billings County voters have been traditionally Republican. In each of the last three elections (as of 2016) the Republican candidate has received over 70% of the county's vote.[18] However, it has some third party or independent interest. Billings county gave Ross Perot over 20% of the vote in his 1992 and 1996 campaigns.[19][20] It gave Pat Buchanan approximately 6% when he ran as the Reform Party's candidate in 2000.[21]
| Year | Republican | Democratic | Third parties |
|---|---|---|---|
| 2016 | 81.8% 495 | 9.8% 59 | 8.4% 51 |
| 2012 | 81.7% 472 | 15.4% 89 | 2.9% 17 |
| 2008 | 75.2% 375 | 22.9% 114 | 2.0% 10 |
| 2004 | 79.6% 449 | 17.6% 99 | 2.8% 16 |
| 2000 | 75.1% 394 | 15.6% 82 | 9.3% 49 |
| 1996 | 55.4% 281 | 22.9% 116 | 21.7% 110 |
| 1992 | 41.2% 279 | 18.1% 123 | 40.7% 276 |
| 1988 | 66.3% 437 | 32.0% 211 | 1.7% 11 |
| 1984 | 77.3% 505 | 20.4% 133 | 2.3% 15 |
| 1980 | 76.1% 524 | 17.7% 122 | 6.2% 43 |
| 1976 | 51.3% 351 | 41.7% 285 | 7.0% 48 |
| 1972 | 69.8% 509 | 26.3% 192 | 3.8% 28 |
| 1968 | 61.9% 395 | 27.3% 174 | 10.8% 69 |
| 1964 | 49.4% 340 | 50.6% 348 | |
| 1960 | 47.9% 368 | 52.1% 400 | |
| 1956 | 63.4% 437 | 36.0% 248 | 0.6% 4 |
| 1952 | 82.0% 674 | 17.4% 143 | 0.6% 5 |
| 1948 | 50.5% 372 | 42.3% 311 | 7.2% 53 |
| 1944 | 62.5% 354 | 36.9% 209 | 0.5% 3 |
| 1940 | 62.1% 663 | 37.8% 404 | 0.1% 1 |
| 1936 | 26.7% 329 | 59.2% 729 | 14.1% 174 |
| 1932 | 27.3% 295 | 70.4% 760 | 2.2% 24 |
| 1928 | 52.2% 458 | 47.0% 412 | 0.8% 7 |
| 1924 | 48.3% 421 | 3.7% 32 | 48.0% 418 |
| 1920 | 91.5% 787 | 7.1% 61 | 1.4% 12 |
| 1916 | 49.1% 306 | 44.3% 276 | 6.6% 41 |
| 1912 | 35.3% 671 | 28.8% 547 | 35.9% 681[23] |
| 1908 | 73.7% 768 | 22.7% 236 | 3.7% 38 |
| 1904 | 85.1% 256 | 12.3% 37 | 2.7% 8 |
| 1900 | 74.2% 158 | 23.9% 51 | 1.9% 4 |
Recreation
The Bully Pulpit Golf Course is located three miles south of Medora and the Maah Daah Hey Trail single track non-motorized trail starts 30 miles south of Medora.
References
- "State & County QuickFacts". United States Census Bureau. Retrieved October 31, 2013.
- "Find a County". National Association of Counties. Archived from the original on May 31, 2011. Retrieved June 7, 2011.
- "County History". Official Portal for North Dakota State Government. Archived from the original on February 2, 2015. Retrieved February 14, 2019.
- ND County History/Billings County (accessed 14 February 2019)
- Billings County ND Google Maps (accessed February 14, 2019)
- ""Find an Altitude" Billings County ND - Google Maps (accessed February 14, 2019)". Archived from the original on May 21, 2019. Retrieved February 14, 2019.
- "2010 Census Gazetteer Files". United States Census Bureau. August 22, 2012. Archived from the original on January 29, 2015. Retrieved January 27, 2015.
- Natl Park Srvc/TRNP/South Unit Map (accessed 14 February 2019)
- "Population and Housing Unit Estimates". Retrieved April 6, 2020.
- "US Decennial Census". US Census Bureau. Retrieved January 27, 2015.
- "Historical Census Browser". University of Virginia Library. Retrieved January 27, 2015.
- Forstall, Richard L., ed. (March 27, 1995). "Population of Counties by Decennial Census: 1900 to 1990". US Census Bureau. Retrieved January 27, 2015.
- "Census 2000 PHC-T-4. Ranking Tables for Counties: 1990 and 2000" (PDF). US Census Bureau. April 2, 2001. Retrieved January 27, 2015.
- "Profile of General Population and Housing Characteristics: 2010 Demographic Profile Data". US Census Bureau. Archived from the original on February 13, 2020. Retrieved March 14, 2016.
- "Population, Housing Units, Area, and Density: 2010 - County". US Census Bureau. Archived from the original on February 13, 2020. Retrieved March 14, 2016.
- "Selected Social Characteristics in the US – 2006-2010 American Community Survey 5-Year Estimates". US Census Bureau. Archived from the original on February 13, 2020. Retrieved March 14, 2016.
- "Selected Economic Characteristics – 2006-2010 American Community Survey 5-Year Estimates". US Census Bureau. Archived from the original on February 13, 2020. Retrieved March 14, 2016.
- The New York Times Electoral Map (Zoom in on North Dakota)
- David Leip's Presidential Election Atlas - 1992 statistics
- David Leip's Presidential Election Atlas - 1996 statistics
- David Leip's Presidential Election Atlas - 2000 statistics
- Leip, David. "Atlas of US Presidential Elections". uselectionatlas.org. Retrieved April 12, 2018.
- The leading "other" candidate, Progressive Theodore Roosevelt, received 495 votes, while Socialist candidate Eugene Debs received 161 votes, Prohibition candidate Eugene Chafin received 25 votes.
- Notes
- The total for 1910 includes population (8,009) of townships taken to form Golden Valley in 1912, and Slope Counties in 1915.
External links
- Billings County map, North Dakota DOT
Places adjacent to Billings County, North Dakota | ||||||||||
|---|---|---|---|---|---|---|---|---|---|---|
| ||||||||||
Municipalities and communities of Billings County, North Dakota, United States | ||
|---|---|---|
| City | Map of North Dakota highlighting Billings County | |
| Unorganized territories | ||
| Unincorporated communities | ||

| Authority control |
|
|---|