Sheridan County, Montana
Sheridan County is a county in the U.S. state of Montana. As of the 2010 United States Census, the population was 3,384.[1] Its county seat is Plentywood.[2] Its northern boundary is the Canada–United States border south of Saskatchewan.
Sheridan County | |
|---|---|
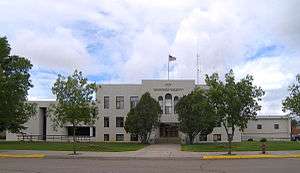 Sheridan County Courthouse in Plentywood | |
 Location within the U.S. state of Montana | |
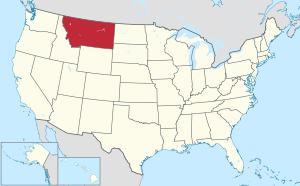 Montana's location within the U.S. | |
| Coordinates: 48°44′N 104°30′W | |
| Country | |
| State | |
| Founded | March 11, 1913 |
| Named for | Philip Sheridan |
| Seat | Plentywood |
| Largest city | Plentywood |
| Area | |
| • Total | 1,706 sq mi (4,420 km2) |
| • Land | 1,677 sq mi (4,340 km2) |
| • Water | 29 sq mi (80 km2) 1.7% |
| Population (2010) | |
| • Total | 3,384 |
| • Estimate (2018) | 3,424 |
| • Density | 2.0/sq mi (0.77/km2) |
| Time zone | UTC−7 (Mountain) |
| • Summer (DST) | UTC−6 (MDT) |
| Congressional district | At-large |
| Website | www |
History
The Montana Legislature established Sheridan County in 1913 from portions of Dawson and Valley Counties. It was named for American Civil War General Philip Sheridan.[3] In the 1920s and 1930s the county was a hotbed of communist organizing. The CPUSA managed to elect several town and county officials. At the 1932 presidential election the communist candidate William Z. Foster got 576 votes (22%).[4] International changes in communist organizing strategies, especially the move towards the popular front, effectively ended communist presence in the area.[5]
Geography
According to the U.S. Census Bureau, the county has a total area of 1,706 square miles (4,420 km2), of which 1,677 square miles (4,340 km2) is land and 29 square miles (75 km2) (1.7%) is water.[6]
Major highways
Adjacent counties and rural municipalities
- Daniels County - west
- Roosevelt County - south
- Williams County, North Dakota - east
- Divide County, North Dakota - east
- Happy Valley No. 10, Saskatchewan - north
- Surprise Valley No. 9, Saskatchewan - north
- Lake Alma No. 8, Saskatchewan - north
National protected area
Demographics
| Historical population | |||
|---|---|---|---|
| Census | Pop. | %± | |
| 1920 | 13,847 | — | |
| 1930 | 9,869 | −28.7% | |
| 1940 | 7,814 | −20.8% | |
| 1950 | 6,674 | −14.6% | |
| 1960 | 6,458 | −3.2% | |
| 1970 | 5,779 | −10.5% | |
| 1980 | 5,414 | −6.3% | |
| 1990 | 4,732 | −12.6% | |
| 2000 | 4,105 | −13.3% | |
| 2010 | 3,384 | −17.6% | |
| Est. 2018 | 3,424 | [7] | 1.2% |
| US Decennial Census[8] 1790-1960[9] 1900-1990[10] 1990-2000[11] 2010-2018[1] | |||
2000 census
As of the 2000 United States Census,[12] there were 4,105 people, 1,741 households, and 1,140 families living in the county. The population density was 2.4 people per square mile (0.9/km²). There were 2,167 housing units at an average density of 1.3 per square mile (0.5/km²). The racial makeup of the county was 97.00% White, 0.10% Black or African American, 1.22% Native American, 0.29% Asian, 0.02% Pacific Islander, 0.19% from other races, and 1.17% from two or more races. 1.07% of the population were Hispanic or Latino of any race. 35.5% were of Norwegian, 19.0% German and 8.9% Danish ancestry.
There were 1,741 households out of which 27.00% had children under the age of 18 living with them, 57.50% were married couples living together, 4.80% had a female householder with no husband present, and 34.50% were non-families. 32.30% of all households were made up of individuals and 16.60% had someone living alone who was 65 years of age or older. The average household size was 2.29 and the average family size was 2.87.
The county population contained 22.90% under the age of 18, 4.80% from 18 to 24, 22.20% from 25 to 44, 26.50% from 45 to 64, and 23.60% who were 65 years of age or older. The median age was 45 years. For every 100 females there were 98.70 males. For every 100 females age 18 and over, there were 96.80 males.
The median income for a household in the county was $29,518, and the median income for a family was $35,345. Males had a median income of $23,053 versus $20,112 for females. The per capita income for the county was $16,038. About 10.60% of families and 14.70% of the population were below the poverty line, including 16.40% of those under age 18 and 15.80% of those age 65 or over.
2010 census
As of the 2010 United States Census, there were 3,384 people, 1,587 households, and 944 families living in the county.[13] The population density was 2.0 inhabitants per square mile (0.77/km2). There were 2,089 housing units at an average density of 1.2 per square mile (0.46/km2).[14] The racial makeup of the county was 95.4% white, 1.7% American Indian, 0.4% Asian, 0.2% black or African American, 0.3% from other races, and 2.0% from two or more races. Those of Hispanic or Latino origin made up 1.5% of the population.[13] In terms of ancestry, 33.8% were Norwegian, 26.0% were German, 12.0% were Danish, 11.6% were Irish, 5.5% were Swedish, 5.3% were English, and 5.0% were American.[15]
Of the 1,587 households, 21.3% had children under the age of 18 living with them, 49.5% were married couples living together, 5.7% had a female householder with no husband present, 40.5% were non-families, and 37.1% of all households were made up of individuals. The average household size was 2.08 and the average family size was 2.70. The median age was 50.3 years.[13]
The median income for a household in the county was $39,578 and the median income for a family was $55,313. Males had a median income of $46,932 versus $22,107 for females. The per capita income for the county was $26,537. About 6.4% of families and 14.5% of the population were below the poverty line, including 8.8% of those under age 18 and 10.4% of those age 65 or over.[16]
Politics
Sheridan County voters have selected the Republican County candidate in 80% of the national elections since 1980.
| Year | Republican | Democratic | Third parties |
|---|---|---|---|
| 2016 | 67.6% 1,241 | 26.0% 477 | 6.4% 117 |
| 2012 | 62.6% 1,207 | 34.5% 665 | 2.9% 56 |
| 2008 | 49.2% 987 | 47.5% 953 | 3.3% 66 |
| 2004 | 56.9% 1,159 | 41.5% 846 | 1.6% 33 |
| 2000 | 59.9% 1,176 | 35.7% 702 | 4.4% 87 |
| 1996 | 34.2% 832 | 48.8% 1,187 | 17.1% 416 |
| 1992 | 29.9% 795 | 40.4% 1,077 | 29.7% 791 |
| 1988 | 50.0% 1,381 | 49.0% 1,354 | 1.0% 28 |
| 1984 | 61.6% 1,774 | 37.8% 1,087 | 0.6% 18 |
| 1980 | 56.9% 1,658 | 32.8% 955 | 10.3% 299 |
| 1976 | 41.1% 1,114 | 57.5% 1,560 | 1.5% 40 |
| 1972 | 54.0% 1,500 | 43.1% 1,197 | 3.0% 83 |
| 1968 | 45.8% 1,180 | 49.5% 1,275 | 4.7% 121 |
| 1964 | 30.4% 837 | 69.2% 1,905 | 0.4% 12 |
| 1960 | 43.4% 1,196 | 56.3% 1,549 | 0.3% 9 |
| 1956 | 38.3% 1,153 | 61.7% 1,857 | 0.0% 0 |
| 1952 | 49.4% 1,339 | 49.7% 1,347 | 0.9% 25 |
| 1948 | 28.5% 699 | 61.8% 1,515 | 9.7% 239 |
| 1944 | 31.0% 791 | 67.2% 1,713 | 1.7% 44 |
| 1940 | 29.2% 892 | 69.1% 2,108 | 1.7% 52 |
| 1936 | 16.2% 513 | 79.0% 2,503 | 4.8% 152 |
| 1932 | 22.8% 739 | 44.7% 1,450 | 32.6% 1,057 |
| 1928 | 54.7% 1,624 | 40.1% 1,190 | 5.3% 157 |
| 1924 | 35.3% 905 | 6.9% 176 | 57.8% 1,481 |
| 1920 | 53.5% 1,335 | 24.4% 610 | 22.1% 552 |
| 1916 | 32.2% 1,724 | 60.9% 3,264 | 7.0% 375 |
See also
- List of cemeteries in Sheridan County, Montana
- List of lakes in Sheridan County, Montana
- List of mountains in Sheridan County, Montana
- National Register of Historic Places listings in Sheridan County MT
References
- "State & County QuickFacts". US Census Bureau. Retrieved September 16, 2013.
- "Find a County". National Association of Counties. Retrieved June 7, 2011.
- "Montana Place Names Companion". Montana Place Names From Alzada to Zortman. Montana Historical Society Research Center. Retrieved May 9, 2011.
- "Communist Party votes by county". depts.washington.edu. Retrieved July 5, 2017.
- Stoner McDonald, Verlaine (2010). The Red Corner: The Rise and Fall of Communism in Northeastern Montana. Montana Historical Society Press.
- "2010 Census Gazetteer Files". US Census Bureau. August 22, 2012. Archived from the original on December 5, 2014. Retrieved November 30, 2014.
- "Population and Housing Unit Estimates". Retrieved August 6, 2019.
- "US Decennial Census". US Census Bureau. Retrieved November 30, 2014.
- "Historical Census Browser". University of Virginia Library. Retrieved November 30, 2014.
- "Population of Counties by Decennial Census: 1900 to 1990". US Census Bureau. Retrieved November 30, 2014.
- "Census 2000 PHC-T-4. Ranking Tables for Counties: 1990 and 2000" (PDF). US Census Bureau. Retrieved November 30, 2014.
- "U.S. Census website". US Census Bureau. Retrieved January 31, 2008.
- "Profile of General Population and Housing Characteristics: 2010 Demographic Profile Data". US Census Bureau]]. Archived from the original on February 13, 2020. Retrieved January 10, 2016.
- "Population, Housing Units, Area, and Density: 2010 - County". US Census Bureau. Archived from the original on February 13, 2020. Retrieved January 10, 2016.
- "Selected Social Characteristics in the US – 2006-2010 American Community Survey 5-Year Estimates". US Census Bureau. Archived from the original on February 13, 2020. Retrieved January 10, 2016.
- "Selected Economic Characteristics – 2006-2010 American Community Survey 5-Year Estimates". US Census Bureau. Archived from the original on February 13, 2020. Retrieved January 10, 2016.
- Leip, David. "Atlas of US Presidential Elections". uselectionatlas.org. Retrieved April 3, 2018.
- Coalridge MT Google Maps (accessed 6 January 2019)
- Daleview MT Google Maps (accessed 6 January 2019)
- Homestead MT Google Maps (accessed 6 January 2019)
- Redstone MT Google Maps (accessed 6 January 2019)
- Rock Crossing MT Google Maps (accessed 6 January 2019)
External links
| Wikimedia Commons has media related to Sheridan County, Montana. |
Places adjacent to Sheridan County, Montana | ||||||||||
|---|---|---|---|---|---|---|---|---|---|---|
| ||||||||||
Municipalities and communities of Sheridan County, Montana, United States | ||
|---|---|---|
| City | Sheridan County map | |
| Towns | ||
| CDPs | ||
| Unincorporated communities | ||
| Ghost town | ||
| Indian reservations | ||
| Footnotes | ‡This populated place also has portions in an adjacent county or counties | |
| Authority control |
|
|---|