Ramsey County, North Dakota
Ramsey County is a county in the U.S. state of North Dakota. As of the 2010 United States Census, the population was 11,451.[1] Its county seat is Devils Lake.[2]
Ramsey County | |
|---|---|
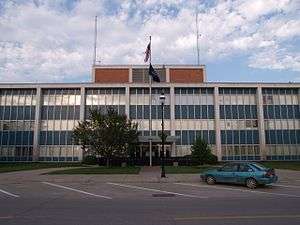 Ramsey County Courthouse in Devils Lake, North Dakota. | |
 Location within the U.S. state of North Dakota | |
 North Dakota's location within the U.S. | |
| Coordinates: 48°15′N 98°43′W | |
| Country | |
| State | |
| Founded | January 4, 1873 (created) January 25, 1883 (organized) |
| Named for | Alexander Ramsey |
| Seat | Devils Lake |
| Largest city | Devils Lake |
| Area | |
| • Total | 1,301 sq mi (3,370 km2) |
| • Land | 1,187 sq mi (3,070 km2) |
| • Water | 114 sq mi (300 km2) 8.8% |
| Population (2010) | |
| • Total | 11,451 |
| • Estimate (2019) | 11,519 |
| • Density | 8.8/sq mi (3.4/km2) |
| Time zone | UTC−6 (Central) |
| • Summer (DST) | UTC−5 (CDT) |
| Congressional district | At-large |
| Website | www |
History
The Dakota Territory legislature created the county on January 4, 1873, with areas partitioned from Pembina County. The county was named for Alexander Ramsey, a US Senator from Minnesota.[3] The county government was not completed at that time, and the county was not attached to another county for administrative or judicial purposes. This situation continued until January 25, 1883, when the county government was effected.
The county's boundaries were altered two times in March 1883, two times in 1885, and in 1890. Its present boundaries have remained unchanged since 1890.[4]
Geography
The southwest boundary of Ramsey County is defined by Devils Lake. The county terrain consists of rolling hills, dotted with lakes and ponds. The area is largely devoted to agriculture.[5] The terrain slopes to the lake, with its highest point at the NE county corner, at 1,631' (497m) ASL.[6] The county has a total area of 1,301 square miles (3,370 km2), of which 1,187 square miles (3,070 km2) is land and 114 square miles (300 km2) (8.8%) is water.[7]
Major highways


Adjacent counties
- Cavalier County - north
- Walsh County - east
- Nelson County - southeast
- Benson County - southwest
- Towner County - northwest
National protected areas
Lakes[5]
- Chain Lake
- Creel Bay
- Dry Lake
- East Devils Lake
- Lake Alice
- Lake Irvine
- Mikes Lake
- Morrison Lake
- Sixmile Bay
- Sweetwate Lake
Demographics
| Historical population | |||
|---|---|---|---|
| Census | Pop. | %± | |
| 1880 | 281 | — | |
| 1890 | 4,418 | 1,472.2% | |
| 1900 | 9,198 | 108.2% | |
| 1910 | 15,199 | 65.2% | |
| 1920 | 15,427 | 1.5% | |
| 1930 | 16,252 | 5.3% | |
| 1940 | 15,626 | −3.9% | |
| 1950 | 14,373 | −8.0% | |
| 1960 | 13,443 | −6.5% | |
| 1970 | 12,915 | −3.9% | |
| 1980 | 13,048 | 1.0% | |
| 1990 | 12,681 | −2.8% | |
| 2000 | 12,066 | −4.8% | |
| 2010 | 11,451 | −5.1% | |
| Est. 2019 | 11,519 | [8] | 0.6% |
| US Decennial Census[9] 1790-1960[10] 1900-1990[11] 1990-2000[12] 2010-2019[1] | |||
2000 census
As of the 2000 United States Census, there were 12,066 people, 4,957 households, and 3,187 families in the county. The population density was 10.2/sqmi (3.92/km²). There were 5,729 housing units at an average density of 4.83/sqmi (1.86/km²). The racial makeup of the county was 92.31% White, 0.21% Black or African American, 5.40% Native American, 0.26% Asian, 0.02% Pacific Islander, 0.17% from other races, and 1.64% from two or more races. 0.52% of the population were Hispanic or Latino of any race. 37.7% were of German and 33.7% Norwegian ancestry.
There were 4,957 households out of which 29.90% had children under the age of 18 living with them, 51.80% were married couples living together, 8.50% had a female householder with no husband present, and 35.70% were non-families. 31.10% of all households were made up of individuals and 14.60% had someone living alone who was 65 years of age or older. The average household size was 2.34 and the average family size was 2.94.
The county population contained 25.00% under the age of 18, 8.00% from 18 to 24, 25.90% from 25 to 44, 22.30% from 45 to 64, and 18.80% who were 65 years of age or older. The median age was 40 years. For every 100 females there were 97.40 males. For every 100 females age 18 and over, there were 94.40 males.
The median income for a household in the county was $35,600, and the median income for a family was $42,439. Males had a median income of $29,562 versus $18,629 for females. The per capita income for the county was $18,060. About 8.70% of families and 12.60% of the population were below the poverty line, including 16.90% of those under age 18 and 8.00% of those age 65 or over.
2010 census
As of the 2010 census, there were 11,451 people, 4,955 households, and 3,008 families in the county.[13] The population density was 9.65/sqmi (3.72/km²). There were 5,615 housing units at an average density of 4.73/sqmi (1.83/km²).[14] The racial makeup of the county was 87.7% white, 8.7% American Indian, 0.4% black or African American, 0.4% Asian, 0.2% from other races, and 2.6% from two or more races. Those of Hispanic or Latino origin made up 1.2% of the population.[13] In terms of ancestry, 41.9% were German, 37.7% were Norwegian, 7.0% were Irish, 5.7% were Swedish, 5.2% were English, and 2.9% were American.[15]
Of the 4,955 households, 27.5% had children under the age of 18 living with them, 47.0% were married couples living together, 9.5% had a female householder with no husband present, 39.3% were non-families, and 34.5% of all households were made up of individuals. The average household size was 2.21 and the average family size was 2.82. The median age was 43.0 years.[13]
The median income for a household in the county was $41,792 and the median income for a family was $56,632. Males had a median income of $41,274 versus $25,171 for females. The per capita income for the county was $24,130. About 8.7% of families and 11.5% of the population were below the poverty line, including 16.7% of those under age 18 and 15.4% of those age 65 or over.[16]
Communities
Cities
- Brocket
- Churchs Ferry
- Crary
- Devils Lake (county seat)
- Edmore
- Hampden
- Lawton
- Starkweather
Unincorporated communities[5]
Townships
- Bartlett
- Cato
- Chain Lakes
- Coulee
- Creel
- De Groat
- Dry Lake
- Fancher
- Freshwater
- Grand Harbor
- Hammer
- Harding
- Highland Center
- Hope
- Klingstrup
- Lawton
- Lillehoff
- Minnewaukan
- Morris
- Newbre
- Newland
- Noonan
- North Creel
- Northfield
- Odessa
- Ontario
- Overland
- Pelican
- Poplar Grove
- Prospect
- Royal
- South Minnewaukan
- Stevens
- Sullivan
- Triumph
- Webster
Politics
Ramsey County voters have traditionally voted Republican. In only two national elections since 1944 has the county selected the Democratic Party candidate (as of 2016).
| Year | Republican | Democratic | Third parties |
|---|---|---|---|
| 2016 | 60.6% 3,217 | 28.4% 1,505 | 11.0% 583 |
| 2012 | 53.3% 2,665 | 43.3% 2,164 | 3.4% 170 |
| 2008 | 49.6% 2,361 | 48.6% 2,314 | 1.8% 87 |
| 2004 | 60.1% 2,943 | 38.5% 1,885 | 1.5% 72 |
| 2000 | 60.4% 3,005 | 33.3% 1,658 | 6.3% 314 |
| 1996 | 43.5% 2,077 | 44.5% 2,123 | 12.0% 574 |
| 1992 | 41.6% 2,516 | 33.2% 2,008 | 25.3% 1,530 |
| 1988 | 53.1% 3,103 | 45.6% 2,665 | 1.3% 73 |
| 1984 | 63.3% 4,150 | 35.2% 2,304 | 1.5% 99 |
| 1980 | 64.9% 4,078 | 25.6% 1,607 | 9.6% 600 |
| 1976 | 50.7% 3,293 | 47.6% 3,096 | 1.7% 113 |
| 1972 | 61.8% 3,954 | 37.3% 2,384 | 1.0% 62 |
| 1968 | 54.6% 3,189 | 40.8% 2,384 | 4.7% 272 |
| 1964 | 40.2% 2,409 | 59.7% 3,572 | 0.1% 6 |
| 1960 | 56.1% 3,599 | 43.9% 2,813 | 0.0% 1 |
| 1956 | 64.4% 3,821 | 35.5% 2,103 | 0.1% 6 |
| 1952 | 72.0% 4,670 | 27.7% 1,794 | 0.4% 25 |
| 1948 | 52.0% 2,891 | 44.3% 2,458 | 3.7% 206 |
| 1944 | 49.3% 2,505 | 50.0% 2,539 | 0.8% 39 |
| 1940 | 50.4% 3,629 | 49.1% 3,530 | 0.5% 35 |
| 1936 | 25.5% 1,784 | 65.2% 4,559 | 9.3% 650 |
| 1932 | 30.3% 1,917 | 68.5% 4,337 | 1.2% 75 |
| 1928 | 54.6% 3,246 | 45.0% 2,672 | 0.4% 25 |
| 1924 | 62.4% 3,110 | 7.2% 359 | 30.5% 1,519 |
| 1920 | 79.3% 3,996 | 18.6% 937 | 2.1% 104 |
| 1916 | 44.9% 1,169 | 51.1% 1,331 | 4.0% 103 |
| 1912 | 32.2% 739 | 39.9% 917 | 27.9% 640 |
| 1908 | 55.8% 1,480 | 40.4% 1,072 | 3.8% 101 |
| 1904 | 76.5% 1,523 | 19.4% 386 | 4.2% 83 |
| 1900 | 67.8% 1,147 | 29.3% 496 | 2.9% 49 |
References
- "State & County QuickFacts". United States Census Bureau. Retrieved November 1, 2013.
- "Find a County". National Association of Counties. Retrieved June 7, 2011.
- "County History". Official Portal for North Dakota State Government. Archived from the original on February 2, 2015. Retrieved May 4, 2011.
- "Dakota Territory, South Dakota, and North Dakota: Individual County Chronologies". Dakota Territory Atlas of Historical County Boundaries. The Newberry Library. 2006. Retrieved February 4, 2015.
- Ramsey County ND Google Maps (accessed February 26, 2019)
- "Find an Altitude/Ramsey County ND" Google Maps (accessed February 26, 2019)". Archived from the original on May 21, 2019. Retrieved February 26, 2019.
- "2010 Census Gazetteer Files". US Census Bureau. August 22, 2012. Archived from the original on January 29, 2015. Retrieved February 1, 2015.
- "Population and Housing Unit Estimates". Retrieved March 31, 2020.
- "US Decennial Census". US Census Bureau. Retrieved February 1, 2015.
- "Historical Census Browser". University of Virginia Library. Retrieved February 1, 2015.
- Forstall, Richard L., ed. (April 20, 1995). "Population of Counties by Decennial Census: 1900 to 1990". US Census Bureau. Retrieved February 1, 2015.
- "Census 2000 PHC-T-4. Ranking Tables for Counties: 1990 and 2000" (PDF). US Census Bureau. April 2, 2001. Retrieved February 1, 2015.
- "Profile of General Population and Housing Characteristics: 2010 Demographic Profile Data". US Census Bureau. Archived from the original on February 13, 2020. Retrieved April 3, 2016.
- "Population, Housing Units, Area, and Density: 2010 - County". US Census Bureau. Archived from the original on February 13, 2020. Retrieved April 3, 2016.
- "Selected Social Characteristics in the US – 2006-2010 American Community Survey 5-Year Estimates". US Census Bureau. Archived from the original on February 13, 2020. Retrieved April 3, 2016.
- "Selected Economic Characteristics – 2006-2010 American Community Survey 5-Year Estimates". US Census Bureau. Archived from the original on February 13, 2020. Retrieved April 3, 2016.
- Leip, David. "Atlas of US Presidential Elections". uselectionatlas.org. Retrieved April 13, 2018.
External links
- Ramsey County official website
- Ramsey County maps, Sheet 1 (northern) and Sheet 2 (southern), North Dakota DOT
Places adjacent to Ramsey County, North Dakota | ||||||||||
|---|---|---|---|---|---|---|---|---|---|---|
| ||||||||||
Municipalities and communities of Ramsey County, North Dakota, United States | ||
|---|---|---|
| Cities | Map of North Dakota highlighting Ramsey County | |
| Townships |
| |
| Unincorporated communities | ||

| Authority control |
|
|---|