Foster County, North Dakota
Foster County is a county in the U.S. state of North Dakota. As of the 2010 United States Census, the population was 3,343.[1] Its county seat is Carrington.[2]
Foster County | |
|---|---|
 Foster County Courthouse in Carrington, North Dakota. | |
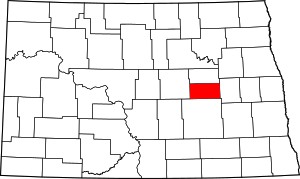 Location within the U.S. state of North Dakota | |
 North Dakota's location within the U.S. | |
| Coordinates: 47°28′N 98°53′W | |
| Country | |
| State | |
| Founded | January 4, 1873 (created) October 11, 1883 (organized) |
| Seat | Carrington |
| Largest city | Carrington |
| Area | |
| • Total | 647 sq mi (1,680 km2) |
| • Land | 635 sq mi (1,640 km2) |
| • Water | 11 sq mi (30 km2) 1.8% |
| Population (2010) | |
| • Total | 3,343 |
| • Estimate (2019) | 3,210 |
| • Density | 5.2/sq mi (2.0/km2) |
| Time zone | UTC−6 (Central) |
| • Summer (DST) | UTC−5 (CDT) |
| Congressional district | At-large |
| Website | www |
History
The Dakota Territory legislature created the county on January 4, 1873, with lands partitioned from Pembina County. It was named for George I. Foster, a pioneer and member of the Territorial legislature.[3] Its governing structure was not completed at that time, and it was not attached to another county for administrative purposes. Its boundaries were altered in 1881, two times in 1883, and finally in 1885 its boundary was set at the present configuration. Its county organization was effected on October 11, 1883.[4][5]
Geography
The James River flows south-southeastward through the central part of Foster County. The county terrain consists of low rolling hills, mostly devoted to agriculture, its eastern portion dotted with lakes and ponds.[6] The terrain slopes to the south and east; its highest point is at its SW corner, at 1,942' (592m) ASL.[7] The county has a total area of 647 square miles (1,680 km2), of which 635 square miles (1,640 km2) is land and 11 square miles (28 km2) (1.8%) is water.[8] It is the second-smallest county in North Dakota by area.
Major highways


Adjacent counties
- Eddy County - north
- Griggs County - east
- Stutsman County - south
- Wells County - west
National protected area
Lakes[6]
- Blue Cloud Lake
- Jack Lake
- Juanita Lake
- Lake Bonita
- Lake George
- Russell Lake
Demographics
| Historical population | |||
|---|---|---|---|
| Census | Pop. | %± | |
| 1880 | 37 | — | |
| 1890 | 1,210 | 3,170.3% | |
| 1900 | 3,770 | 211.6% | |
| 1910 | 5,313 | 40.9% | |
| 1920 | 6,108 | 15.0% | |
| 1930 | 6,353 | 4.0% | |
| 1940 | 5,824 | −8.3% | |
| 1950 | 5,337 | −8.4% | |
| 1960 | 5,361 | 0.4% | |
| 1970 | 4,832 | −9.9% | |
| 1980 | 4,611 | −4.6% | |
| 1990 | 3,983 | −13.6% | |
| 2000 | 3,759 | −5.6% | |
| 2010 | 3,343 | −11.1% | |
| Est. 2019 | 3,210 | [9] | −4.0% |
| US Decennial Census[10] 1790-1960[11] 1900-1990[12] 1990-2000[13] 2010-2019[1] | |||
2000 census
As of the 2000 United States Census, there were 3,759 people, 1,540 households, and 1,031 families in the county. The population density was 2/km² (6/sq mi). There were 1,793 housing units at an average density of 1/km² (3/sq mi). The racial makeup of the county was 99.02% White, 0.13% Black or African American, 0.43% Native American, 0.05% from other races, and 0.37% from two or more races. 0.19% of the population were Hispanic or Latino of any race. 43.1% were of German, 31.0% Norwegian and 5.4% Irish ancestry.
There were 1,540 households out of which 31.00% had children under the age of 18 living with them, 57.50% were married couples living together, 6.40% had a female householder with no husband present, and 33.00% were non-families. 30.60% of all households were made up of individuals and 16.00% had someone living alone who was 65 years of age or older. The average household size was 2.39 and the average family size was 2.99.
The county population contained 26.20% under the age of 18, 5.50% from 18 to 24, 25.90% from 25 to 44, 21.00% from 45 to 64, and 21.40% who were 65 years of age or older. The median age was 40 years. For every 100 females there were 98.80 males. For every 100 females age 18 and over, there were 95.80 males.
The median income for a household in the county was $32,019, and the median income for a family was $40,469. Males had a median income of $31,442 versus $19,750 for females. The per capita income for the county was $17,928. About 7.60% of families and 9.30% of the population were below the poverty line, including 10.90% of those under age 18 and 12.40% of those age 65 or over.
2010 census
As of the 2010 United States Census, there were 3,343 people, 1,495 households, and 930 families in the county.[14] The population density was 5.3 inhabitants per square mile (2.0/km2). There were 1,801 housing units at an average density of 2.8 per square mile (1.1/km2).[15] The racial makeup of the county was 98.4% white, 0.6% American Indian, 0.1% black or African American, 0.1% Asian, 0.2% from other races, and 0.5% from two or more races. Those of Hispanic or Latino origin made up 0.9% of the population.[14] In terms of ancestry, 54.2% were German, 35.9% were Norwegian, 9.8% were Irish, 5.8% were American, and 5.1% were Swedish.[16]
Of the 1,495 households, 23.7% had children under the age of 18 living with them, 53.4% were married couples living together, 5.5% had a female householder with no husband present, 37.8% were non-families, and 33.5% of all households were made up of individuals. The average household size was 2.20 and the average family size was 2.81. The median age was 46.7 years.[14]
The median income for a household in the county was $41,066 and the median income for a family was $55,278. Males had a median income of $40,076 versus $29,189 for females. The per capita income for the county was $27,945. About 3.4% of families and 7.3% of the population were below the poverty line, including 5.2% of those under age 18 and 13.4% of those age 65 or over.[17]
Communities
Cities
- Carrington (county seat)
- Glenfield
- Grace City
- McHenry
Townships
- Birtsell
- Bordulac
- Bucephalia
- Carrington
- Eastman
- Estabrook
- Florance
- Glenfield
- Haven
- Larrabee
- Longview
- McHenry
- McKinnon
- Melville
- Nordmore
- Rolling Prairie
- Rose Hill
- Wyard
Politics
Foster County voters have traditionally voted Republican. In only two national elections since 1948 has the county selected the Democratic Party candidate (as of 2016).
| Year | Republican | Democratic | Third parties |
|---|---|---|---|
| 2016 | 72.2% 1,241 | 20.2% 347 | 7.6% 131 |
| 2012 | 61.2% 1,030 | 36.1% 607 | 2.7% 45 |
| 2008 | 55.4% 914 | 41.6% 687 | 3.0% 50 |
| 2004 | 69.0% 1,219 | 29.3% 518 | 1.6% 29 |
| 2000 | 67.2% 1,172 | 27.2% 474 | 5.6% 97 |
| 1996 | 45.9% 801 | 38.1% 664 | 16.0% 279 |
| 1992 | 41.4% 803 | 29.1% 565 | 29.5% 572 |
| 1988 | 58.8% 1,218 | 40.4% 837 | 0.7% 15 |
| 1984 | 64.2% 1,422 | 34.6% 765 | 1.2% 27 |
| 1980 | 66.6% 1,534 | 25.5% 586 | 8.0% 183 |
| 1976 | 48.6% 1,120 | 49.8% 1,147 | 1.7% 38 |
| 1972 | 60.3% 1,352 | 38.4% 861 | 1.3% 30 |
| 1968 | 52.3% 1,119 | 41.9% 897 | 5.8% 123 |
| 1964 | 41.3% 927 | 58.6% 1,315 | 0.1% 2 |
| 1960 | 53.3% 1,351 | 46.7% 1,182 | |
| 1956 | 53.5% 1,234 | 46.1% 1,062 | 0.4% 10 |
| 1952 | 64.2% 1,558 | 35.5% 862 | 0.3% 8 |
| 1948 | 44.8% 938 | 52.0% 1,089 | 3.2% 66 |
| 1944 | 44.4% 891 | 54.9% 1,102 | 0.7% 14 |
| 1940 | 43.2% 1,109 | 56.3% 1,446 | 0.5% 12 |
| 1936 | 24.8% 685 | 68.7% 1,894 | 6.5% 180 |
| 1932 | 24.7% 609 | 74.4% 1,838 | 1.0% 24 |
| 1928 | 49.0% 1,137 | 50.8% 1,178 | 0.3% 6 |
| 1924 | 45.1% 922 | 14.1% 287 | 40.8% 834 |
| 1920 | 79.0% 1,583 | 18.5% 371 | 2.5% 50 |
| 1916 | 44.5% 549 | 53.6% 662 | 1.9% 24 |
| 1912 | 30.0% 285 | 42.4% 403 | 27.7% 263 |
| 1908 | 56.0% 569 | 42.7% 434 | 1.3% 13 |
| 1904 | 71.7% 618 | 25.9% 223 | 2.4% 21 |
| 1900 | 61.5% 415 | 35.7% 241 | 2.8% 19 |
References
- "State & County QuickFacts". United States Census Bureau. Archived from the original on June 7, 2011. Retrieved October 31, 2013.
- "Find a County". National Association of Counties. Archived from the original on May 31, 2011. Retrieved June 7, 2011.
- Gannett, Henry (1905). The Origin of Certain Place Names in the United States. Govt. Print. Off. p. 130.
- "Dakota Territory, South Dakota, and North Dakota: Individual County Chronologies". Dakota Territory Atlas of Historical County Boundaries. The Newberry Library. 2006. Retrieved February 3, 2015.
- "County History". North Dakota.gov. The State of North Dakota. Archived from the original on February 2, 2015. Retrieved February 3, 2015.
- Foster County ND Google Maps (accessed 18 February 2019)
- ""Find an Altitude/Foster County ND" Google Maps (accessed 18 February 2019)". Archived from the original on May 21, 2019. Retrieved February 18, 2019.
- "2010 Census Gazetteer Files". US Census Bureau. August 22, 2012. Archived from the original on January 29, 2015. Retrieved January 28, 2015.
- "Population and Housing Unit Estimates". Retrieved April 3, 2020.
- "US Decennial Census". US Census Bureau. Retrieved January 28, 2015.
- "Historical Census Browser". University of Virginia Library. Retrieved January 28, 2015.
- Forstall, Richard L., ed. (March 27, 1995). "Population of Counties by Decennial Census: 1900 to 1990". US Census Bureau. Retrieved January 28, 2015.
- "Census 2000 PHC-T-4. Ranking Tables for Counties: 1990 and 2000" (PDF). US Census Bureau. April 2, 2001. Retrieved January 28, 2015.
- "DP-1 Profile of General Population and Housing Characteristics: 2010 Demographic Profile Data". US Census Bureau. Archived from the original on February 13, 2020. Retrieved March 14, 2016.
- "Population, Housing Units, Area, and Density: 2010 - County". US Census Bureau. Archived from the original on February 13, 2020. Retrieved March 14, 2016.
- "Selected Social Characteristics in the US – 2006-2010 American Community Survey 5-Year Estimates". US Census Bureau. Archived from the original on February 13, 2020. Retrieved March 14, 2016.
- "Selected Economic Characteristics – 2006-2010 American Community Survey 5-Year Estimates". US Census Bureau. Archived from the original on February 13, 2020. Retrieved March 14, 2016.
- Leip, David. "Atlas of US Presidential Elections". uselectionatlas.org. Retrieved April 12, 2018.
External links
| Wikivoyage has a travel guide for Foster County (North Dakota). |
Places adjacent to Foster County, North Dakota | ||||||||||
|---|---|---|---|---|---|---|---|---|---|---|
| ||||||||||
Municipalities and communities of Foster County, North Dakota, United States | ||
|---|---|---|
| Cities | Map of North Dakota highlighting Foster County | |
| Townships |
| |
| Unincorporated communities | ||

| Authority control |
|
|---|