Golden Valley County, North Dakota
Golden Valley County is a county in the U.S. state of North Dakota. As of the 2010 United States Census, the population was 1,680,[1] making it the fourth-least populous county in North Dakota. The county seat is Beach.[2]
Golden Valley County | |
|---|---|
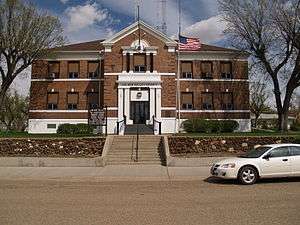 Golden Valley County Courthouse in Beach | |
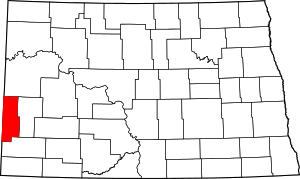 Location within the U.S. state of North Dakota | |
 North Dakota's location within the U.S. | |
| Coordinates: 46°56′N 103°50′W | |
| Country | |
| State | |
| Founded | 1912 |
| Seat | Beach |
| Largest city | Beach |
| Area | |
| • Total | 1,002 sq mi (2,600 km2) |
| • Land | 1,001 sq mi (2,590 km2) |
| • Water | 1.6 sq mi (4 km2) 0.2% |
| Population (2010) | |
| • Total | 1,680 |
| • Estimate (2019) | 1,761 |
| • Density | 1.7/sq mi (0.65/km2) |
| Time zone | UTC−7 (Mountain) |
| • Summer (DST) | UTC−6 (MDT) |
| Congressional district | At-large |
| Website | www |
The county should not be confused with the city of Golden Valley, which is located in Mercer County.
History
In the general election held November 8, 1910, the voters of Billings County chose to separate the western portion of Billings and form a new county. This result was immediately challenged in court; on September 19, 1912 the ND Supreme Court upheld the election result; therefore the legislature completed the county's organization on November 13, 1912.[3]
Golden Valley was called 'Rattlesnake Flats' by early settlers, due to the large number of the snakes found in the area. The region was dubbed Golden Valley in 1902 after a group of land surveyors noticed that the sunlight gave the surrounding grasses a distinct golden color.[4]
Election controversy
The vote in 1910 to create Golden Valley County was 837 for and 756 against. Shortly after the vote was certified, suit was filed against the Billings County Commission to overturn the result. The plaintiffs alleged that the certification of election was improper, and that certain pre-marked "unofficial" ballots printed by supporters of the new county were cast in place of official ballots, and should be voided. The trial court originally ruled in favor of the plaintiffs. The county appealed to the North Dakota Supreme Court, which upheld the county's certification of the election. The court also ruled the pre-marked ballots were invalid, but that the number of invalid votes was not sufficient to overturn the election results.[5] The court's decision upholding the new county was made on September 19, 1912, and Golden Valley was formally organized on November 13, 1912.
Geography
Golden Valley County lies on the west line of North Dakota. Its west boundary line abuts the east boundary line of the state of Montana. Beaver Creek flows east-northeastward through the upper portion of the county, and Little Missouri River flows northeastward through the SE corner of the county, with gullies flowing southeastward draining the lower county into the Little Mo River. The county terrain consists of semi-arid hills, dedicated to agriculture in the level areas. The county is small but it is unique.[6] The terrain slopes to the east and north, with its highest point on hills at the SW corner at 3,251' (991m) ASL.[7] The county has a total area of 1,002 square miles (2,600 km2), of which 1,001 square miles (2,590 km2) is land and 1.6 square miles (4.1 km2) (0.2%) is water.[8]
Major highways


Adjacent counties
- McKenzie County (north)
- Billings County (east)
- Slope County (south)
- Fallon County, Montana (southwest)
- Wibaux County, Montana (west)
National protected area
Lakes[6]
- Bosserman Lake
- Camels Hump Lake
- Odland Dam
Demographics
| Historical population | |||
|---|---|---|---|
| Census | Pop. | %± | |
| 1920 | 4,832 | — | |
| 1930 | 4,122 | −14.7% | |
| 1940 | 3,498 | −15.1% | |
| 1950 | 3,499 | 0.0% | |
| 1960 | 3,100 | −11.4% | |
| 1970 | 2,611 | −15.8% | |
| 1980 | 2,391 | −8.4% | |
| 1990 | 2,108 | −11.8% | |
| 2000 | 1,924 | −8.7% | |
| 2010 | 1,680 | −12.7% | |
| Est. 2019 | 1,761 | [9] | 4.8% |
| US Decennial Census[10] 1790-1960[11] 1900-1990[12] 1990-2000[13] 2010-2019[1] | |||
2000 census
As of the 2000 United States Census, there were 1,924 people, 761 households, and 506 families in the county. The population density was 1.92 people per square mile (0.74/km²). There were 973 housing units at an average density of 0.97 per square mile (0.37/km²). The racial makeup of the county was 97.77% White, 0.73% Native American, 0.10% Asian, 0.31% from other races, and 1.09% from two or more races. 1.04% of the population is Hispanic or Latino of any race. 49.4% were of German, 13.7% Norwegian and 5.6% Polish ancestry.
There were 761 households out of which 29.20% had children under the age of 18 living with them, 58.30% were married couples living together, 4.90% had a female householder with no husband present, and 33.40% were non-families. 31.50% of all households were made up of individuals and 15.80% had someone living alone who was 65 years of age or older. The average household size was 2.38 and the average family size was 3.01.
The county population contained 28.30% under the age of 18, 5.10% from 18 to 24, 22.20% from 25 to 44, 23.00% from 45 to 64, and 21.30% who were 65 years of age or older. The median age was 41 years. For every 100 females there were 92.60 males. For every 100 females age 18 and over, there were 88.10 males.
The median income for a household in the county was $29,967, and the median income for a family was $37,105. Males had a median income of $25,478 versus $18,000 for females. The per capita income for the county was $14,173. About 10.80% of families and 15.30% of the population were below the poverty line, including 21.40% of those under age 18 and 7.70% of those age 65 or over.
2010 census
As of the 2010 census, there were 1,680 people, 774 households, and 429 families in the county.[14] The population density was 1.7 inhabitants per square mile (0.66/km2). There were 967 housing units at an average density of 1.0 per square mile (0.39/km2).[15] The racial makeup of the county was 97.4% white, 0.6% American Indian, 0.6% black or African American, 0.1% Pacific islander, 0.1% Asian, 0.5% from other races, and 0.8% from two or more races. Those of Hispanic or Latino origin made up 2.1% of the population.[14] In terms of ancestry, 69.0% were German, 14.7% were Norwegian, 10.7% were Polish, 7.9% were Irish, 7.5% were English, and 2.5% were American.[16]
Of the 774 households, 22.7% had children under the age of 18 living with them, 48.4% were married couples living together, 4.3% had a female householder with no husband present, 44.6% were non-families, and 39.4% of all households were made up of individuals. The average household size was 2.10 and the average family size was 2.85. The median age was 45.9 years.[14]
The median income for a household in the county was $33,333 and the median income for a family was $47,500. Males had a median income of $32,875 versus $26,750 for females. The per capita income for the county was $21,899. About 8.9% of families and 13.0% of the population were below the poverty line, including 17.7% of those under age 18 and 11.4% of those age 65 or over.[17]
Communities
Cities
- Beach (county seat)
- Golva
- Sentinel Butte
Townships
- Beach
- Bullion
- Delhi
- Elk Creek
- Garner
- Henry
- Lone Tree
- Pearl
- Saddle Butte
- Sentinel
Former townships
Unorganized territories
- East Golden Valley
- Elmwood (formerly a township)
- North Golden Valley
- South Golden Valley
Politics
Golden Valley County voters have been reliably Republican for decades. In no national election since 1936 has the county selected the Democratic Party candidate (as of 2016).
| Year | Republican | Democratic | Third parties |
|---|---|---|---|
| 2016 | 83.2% 796 | 10.3% 99 | 6.5% 62 |
| 2012 | 80.0% 742 | 17.5% 162 | 2.6% 24 |
| 2008 | 73.4% 642 | 24.0% 210 | 2.6% 23 |
| 2004 | 77.6% 719 | 21.0% 195 | 1.4% 13 |
| 2000 | 75.3% 611 | 19.2% 156 | 5.5% 45 |
| 1996 | 56.3% 520 | 25.4% 235 | 18.3% 169 |
| 1992 | 45.2% 503 | 22.9% 255 | 32.0% 356 |
| 1988 | 66.0% 781 | 32.8% 388 | 1.2% 14 |
| 1984 | 73.1% 964 | 24.6% 325 | 2.3% 30 |
| 1980 | 74.6% 1,006 | 19.2% 259 | 6.2% 84 |
| 1976 | 52.4% 633 | 39.7% 479 | 8.0% 96 |
| 1972 | 63.0% 774 | 29.5% 362 | 7.6% 93 |
| 1968 | 61.3% 735 | 29.0% 348 | 9.7% 116 |
| 1964 | 54.5% 722 | 45.5% 602 | |
| 1960 | 55.0% 825 | 44.8% 672 | 0.1% 2 |
| 1956 | 59.0% 824 | 40.6% 567 | 0.4% 6 |
| 1952 | 75.9% 1,186 | 24.1% 376 | |
| 1948 | 56.3% 788 | 41.8% 585 | 2.0% 28 |
| 1944 | 61.2% 709 | 38.3% 443 | 0.5% 6 |
| 1940 | 55.6% 873 | 43.9% 689 | 0.6% 9 |
| 1936 | 35.0% 581 | 59.7% 991 | 5.2% 87 |
| 1932 | 38.5% 653 | 60.4% 1,023 | 1.1% 19 |
| 1928 | 62.5% 937 | 36.8% 552 | 0.7% 10 |
| 1924 | 48.3% 718 | 9.4% 140 | 42.3% 629 |
| 1920 | 77.1% 1,177 | 18.7% 286 | 4.2% 64 |
| 1916 | 39.3% 499 | 54.9% 697 | 5.8% 73 |
Notable people
- Ernest Viggo Almquist, commercial artist [19]
- Arthur C. Townley, founder of the North Dakota Nonpartisan League.[4]
Gallery
 Rangeland, wooded drainageways, and badland
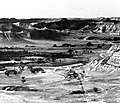 Stream valley, rangeland and badland
 Church building in Trotters
References
- "State & County QuickFacts". United States Census Bureau. Archived from the original on June 7, 2011. Retrieved October 31, 2013.
- "Find a County". National Association of Counties. Retrieved June 7, 2011.
- Long, John H. (2006). "Dakota Territory, South Dakota, and North Dakota: Individual County Chronologies". Dakota Territory Atlas of Historical County Boundaries. The Newberry Library. Archived from the original on November 11, 2007. Retrieved January 31, 2008.
- North Dakota Historical Records Survey (1941). Inventory of the County Archives of North Dakota. 17, Golden Valley County. Bismarck ND: North Dakota Historical Records Survey. Retrieved via Ancestry.com.
- Pederson v. Board of Commissioners of Billings County, 23 N.D. 547. , 137 N.W. 484 (N.D. 1912). Retrieved via Westlaw.
- Golden Valley County ND Google Maps (accessed 18 February 2019)
- ""Find an Altitude/Golden Valley County ND" Google Maps (accessed 18 February 2019)". Archived from the original on May 21, 2019. Retrieved February 18, 2019.
- "2010 Census Gazetteer Files". United States Census Bureau. August 22, 2012. Archived from the original on January 29, 2015. Retrieved January 28, 2015.
- "Population and Housing Unit Estimates". Retrieved April 6, 2020.
- "US Decennial Census". US Census Bureau. Retrieved January 28, 2015.
- "Historical Census Browser". University of Virginia Library. Retrieved January 28, 2015.
- Forstall, Richard L., ed. (March 27, 1995). "Population of Counties by Decennial Census: 1900 to 1990". US Census Bureau. Retrieved January 28, 2015.
- "Census 2000 PHC-T-4. Ranking Tables for Counties: 1990 and 2000" (PDF). US Census Bureau. April 2, 2001. Retrieved January 28, 2015.
- "Profile of General Population and Housing Characteristics: 2010 Demographic Profile Data". US Census Bureau. Archived from the original on February 13, 2020. Retrieved March 14, 2016.
- "Population, Housing Units, Area, and Density: 2010 - County". US Census Bureau. Archived from the original on February 13, 2020. Retrieved March 14, 2016.
- "Selected Social Characteristics in the US – 2006-2010 American Community Survey 5-Year Estimates". US Census Bureau. Archived from the original on February 13, 2020. Retrieved March 14, 2016.
- "Selected Economic Characteristics – 2006-2010 American Community Survey 5-Year Estimates". US Census Bureau. Archived from the original on February 13, 2020. Retrieved March 14, 2016.
- Leip, David. "Atlas of US Presidential Elections". uselectionatlas.org. Retrieved April 12, 2018.
- Frontier Cavalcade, The Dickinson Press, March 14, 1957
External links
- Golden Valley County map, North Dakota DOT
Places adjacent to Golden Valley County, North Dakota | ||||||||||
|---|---|---|---|---|---|---|---|---|---|---|
| ||||||||||
Municipalities and communities of Golden Valley County, North Dakota, United States | ||
|---|---|---|
| Cities | Map of North Dakota highlighting Golden Valley County | |
| Townships | ||
| Unincorporated communities | ||

| Authority control |
|
|---|