Richland County, North Dakota
Richland County is a county in the U.S. state of North Dakota. As of the 2010 census, the population was 16,321.[1] Its county seat is Wahpeton.[2]
Richland County | |
|---|---|
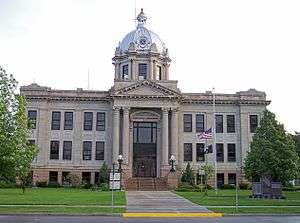 Richland County Courthouse in Wahpeton | |
 Location within the U.S. state of North Dakota | |
 North Dakota's location within the U.S. | |
| Coordinates: 46°16′N 96°57′W | |
| Country | |
| State | |
| Founded | January 4, 1873 (created) November 25, 1873 (organized) |
| Named for | Morgan T. Rich |
| Seat | Wahpeton |
| Largest city | Wahpeton |
| Area | |
| • Total | 1,445 sq mi (3,740 km2) |
| • Land | 1,436 sq mi (3,720 km2) |
| • Water | 9.7 sq mi (25 km2) 0.7% |
| Population (2010) | |
| • Total | 16,321 |
| • Estimate (2019) | 16,177 |
| • Density | 11/sq mi (4.4/km2) |
| Time zone | UTC−6 (Central) |
| • Summer (DST) | UTC−5 (CDT) |
| Congressional district | At-large |
| Website | www |
Richland County is part of the Wahpeton, ND–MN Micropolitan Statistical Area, which is also included in the Fargo-Wahpeton, ND-MN Combined Statistical Area.
History
The Dakota Territory legislature created the county on January 4, 1873, with area partitioned from Pembina County. It was named for Morgan T. Rich, who settled on the site of the future Wahpeton in 1869. The county organization was completed on November 25 of that same year. Its boundaries were altered in 1883 and 1885. It has maintained its present configuration since 1885.[3][4]
Geography
Richland County lies at the SE corner of North Dakota. Its eastern boundary line abuts the western boundary line of the state of Minnesota (across the Red River), and its south boundary line abuts the north boundary line of the state of South Dakota. The Red River flows northerly along its eastern boundary line on its way to the Hudson Bay. The Wild Rice River flows easterly and then northerly through the county, discharging into the Red River north of Richland County, in Cass County. The Sheyenne River flows northeasterly through the NW corner of the county, also discharging into the Red in Cass County.
The Richland County terrain consists of verdant hills, sprinkled with lakes and ponds. It is largely devoted to agriculture.[5] The terrain slopes to the north and east, with its highest point near its SW corner, at 1,220' (372m) ASL.[6] The county has a total area of 1,445 square miles (3,740 km2), of which 1,436 square miles (3,720 km2) is land and 9.7 square miles (25 km2) (0.7%) is water.[7]
Major highways
Adjacent counties
- Cass County - north
- Clay County, Minnesota - northeast
- Wilkin County, Minnesota - east
- Traverse County, Minnesota - southeast
- Roberts County, South Dakota - south
- Marshall County, South Dakota - southwest
- Sargent County - west
- Ransom County - northwest
National protected area
- Sheyenne National Grassland (part)
Lakes[5]
- Bisek Lake
- Grass Lake
- Gullys Slough
- Kreiser Lake
- Lueck Lake
- Moran Lake
- Park Lake
- Silver Lake
- Stacks Slough
- Swan Lake
- Willows Pond
Demographics
| Historical population | |||
|---|---|---|---|
| Census | Pop. | %± | |
| 1880 | 3,597 | — | |
| 1890 | 10,751 | 198.9% | |
| 1900 | 17,387 | 61.7% | |
| 1910 | 19,659 | 13.1% | |
| 1920 | 20,887 | 6.2% | |
| 1930 | 21,008 | 0.6% | |
| 1940 | 20,519 | −2.3% | |
| 1950 | 19,865 | −3.2% | |
| 1960 | 18,824 | −5.2% | |
| 1970 | 18,089 | −3.9% | |
| 1980 | 19,207 | 6.2% | |
| 1990 | 18,148 | −5.5% | |
| 2000 | 17,998 | −0.8% | |
| 2010 | 16,321 | −9.3% | |
| Est. 2019 | 16,177 | [8] | −0.9% |
| US Decennial Census[9] 1790-1960[10] 1900-1990[11] 1990-2000[12] 2010-2019[1] | |||
2000 census
As of the 2000 United States Census, there were 17,998 people, 6,885 households, and 4,427 families in the county. The population density was 12.3/sqmi (4.84/km²). There were 7,575 housing units at an average density of 5.28/sqmi (2.04/km²). The racial makeup of the county was 96.83% White, 0.34% Black or African American, 1.66% Native American, 0.24% Asian, 0.03% Pacific Islander, 0.14% from other races, and 0.74% from two or more races. 0.68% of the population were Hispanic or Latino of any race. 46.5% were of German and 26.9% Norwegian ancestry.
There were 6,885 households out of which 32.4% had children under the age of 18 living with them, 54.2% were married couples living together, 6.5% had a female householder with no husband present, and 35.7% were non-families. 29.4% of all households were made up of individuals and 11.6% had someone living alone who was 65 years of age or older. The average household size was 2.43 and the average family size was 3.06.
The county population contained 24.7% under the age of 18, 14.5% from 18 to 24, 25.6% from 25 to 44, 20.0% from 45 to 64, and 15.3% who were 65 years of age or older. The median age was 35 years. For every 100 females, there were 107.7 males. For every 100 women age 18 and over, there were 108.6 men.
The median income for a household in the county was $36,098, and the median income for a family was $45,484. Men had a median income of $30,829 versus $20,310 for women. The per capita income for the county was $16,339. About 6.1% of families and 10.4% of the population were below the poverty line, including 7.9% of those under age 18 and 9.6% of those age 65 or over.
2010 census
As of the 2010 census, there were 16,321 people, 6,651 households, and 4,171 families in the county.[13] The population density was 11.4 inhabitants per square mile (4.4/km2). There were 7,503 housing units at an average density of 5.2 per square mile (2.0/km2).[14] The racial makeup of the county was 95.0% white, 2.0% American Indian, 0.7% black or African American, 0.5% Asian, 0.1% Pacific islander, 0.4% from other races, and 1.3% from two or more races. Those of Hispanic or Latino origin made up 1.7% of the population.[13] In terms of ancestry, 53.0% were German, 31.2% were Norwegian, 7.0% were Irish, and 2.3% were American.[15]
Of the 6,651 households, 28.3% had children under the age of 18 living with them, 51.6% were married couples living together, 7.1% had a female householder with no husband present, 37.3% were non-families, and 30.9% of all households were made up of individuals. The average household size was 2.31 and the average family size was 2.91. The median age was 39.4 years.[13]
The median income for a household in the county was $47,131 and the median income for a family was $64,636. Males had a median income of $42,597 versus $28,284 for females. The per capita income for the county was $24,342. About 5.2% of families and 10.7% of the population were below the poverty line, including 8.8% of those under age 18 and 11.6% of those age 65 or over.[16]
Communities
Cities
Townships
- Abercrombie
- Antelope
- Barney
- Barrie
- Belford
- Brandenburg
- Brightwood
- Center
- Colfax
- Danton
- Devillo
- Dexter
- Duerr
- Dwight
- Eagle
- Elma
- Fairmount
- Freeman
- Garborg
- Grant
- Greendale
- Helendale
- Homestead
- Ibsen
- LaMars
- Liberty Grove
- Lidgerwood
- Mooreton
- Moran
- Nansen
- Sheyenne
- Summit
- Viking
- Walcott
- Waldo
- West End
- Wyndmere
Politics
Richland County voters have traditionally voted Republican. In only one national election since 1936 has the county selected the Democratic Party candidate (as of 2016).
| Year | Republican | Democratic | Third parties |
|---|---|---|---|
| 2016 | 62.8% 4,767 | 27.2% 2,064 | 10.0% 761 |
| 2012 | 55.6% 4,229 | 42.0% 3,198 | 2.4% 186 |
| 2008 | 51.6% 3,900 | 46.5% 3,513 | 2.0% 150 |
| 2004 | 64.1% 5,264 | 34.3% 2,821 | 1.6% 130 |
| 2000 | 62.4% 4,999 | 31.1% 2,490 | 6.6% 526 |
| 1996 | 47.3% 3,345 | 40.9% 2,890 | 11.8% 834 |
| 1992 | 46.7% 3,873 | 32.4% 2,688 | 21.0% 1,740 |
| 1988 | 56.4% 4,670 | 42.6% 3,523 | 1.0% 81 |
| 1984 | 65.5% 5,980 | 33.4% 3,047 | 1.2% 106 |
| 1980 | 61.2% 5,711 | 28.9% 2,698 | 9.9% 928 |
| 1976 | 51.0% 4,991 | 46.9% 4,592 | 2.1% 202 |
| 1972 | 60.2% 5,194 | 39.0% 3,367 | 0.7% 63 |
| 1968 | 54.4% 4,224 | 39.9% 3,098 | 5.7% 445 |
| 1964 | 43.1% 3,425 | 56.9% 4,525 | 0.1% 5 |
| 1960 | 54.0% 4,711 | 45.9% 4,003 | 0.1% 4 |
| 1956 | 61.0% 4,971 | 38.9% 3,171 | 0.2% 12 |
| 1952 | 69.8% 6,022 | 29.4% 2,541 | 0.8% 67 |
| 1948 | 48.7% 3,448 | 48.2% 3,413 | 3.0% 214 |
| 1944 | 57.7% 4,402 | 41.9% 3,192 | 0.4% 30 |
| 1940 | 58.4% 5,102 | 41.0% 3,584 | 0.6% 48 |
| 1936 | 31.4% 2,386 | 49.9% 3,792 | 18.7% 1,418 |
| 1932 | 28.2% 2,304 | 69.2% 5,663 | 2.6% 216 |
| 1928 | 53.9% 4,251 | 45.7% 3,604 | 0.4% 34 |
| 1924 | 48.8% 3,235 | 11.6% 769 | 39.6% 2,620 |
| 1920 | 79.5% 5,483 | 19.4% 1,339 | 1.1% 78 |
| 1916 | 53.3% 2,097 | 45.0% 1,772 | 1.8% 69 |
| 1912 | 32.0% 1,034 | 42.7% 1,380 | 25.4% 822 |
| 1908 | 54.2% 1,864 | 43.7% 1,502 | 2.2% 75 |
| 1904 | 66.5% 2,420 | 30.7% 1,116 | 2.8% 103 |
| 1900 | 58.5% 2,067 | 39.6% 1,399 | 2.0% 70 |
References
- "State & County QuickFacts". United States Census Bureau. Retrieved November 1, 2013.
- "Find a County". National Association of Counties. Archived from the original on May 31, 2011. Retrieved June 7, 2011.
- "County History". Official Portal for North Dakota State Government. Archived from the original on February 2, 2015. Retrieved May 4, 2011.
- "Dakota Territory, South Dakota, and North Dakota: Individual County Chronologies". Dakota Territory Atlas of Historical County Boundaries. The Newberry Library. 2006. Retrieved February 4, 2015.
- Richland County ND Google Maps (accessed 24 February 2019)
- ""Find an Altitude/Richland County ND" Google Maps (accessed 24 February 2019)". Archived from the original on May 21, 2019. Retrieved February 25, 2019.
- "2010 Census Gazetteer Files". US Census Bureau. August 22, 2012. Archived from the original on January 29, 2015. Retrieved February 1, 2015.
- "Population and Housing Unit Estimates". Retrieved March 27, 2020.
- "US Decennial Census". US Census Bureau. Retrieved February 1, 2015.
- "Historical Census Browser". University of Virginia Library. Retrieved February 1, 2015.
- Forstall, Richard L., ed. (April 20, 1995). "Population of Counties by Decennial Census: 1900 to 1990". US Census Bureau. Retrieved February 1, 2015.
- "Census 2000 PHC-T-4. Ranking Tables for Counties: 1990 and 2000" (PDF). US Census Bureau. April 2, 2001. Retrieved February 1, 2015.
- "Profile of General Population and Housing Characteristics: 2010 Demographic Profile Data". US Census Bureau. Archived from the original on February 13, 2020. Retrieved April 3, 2016.
- "Population, Housing Units, Area, and Density: 2010 - County". US Census Bureau. Archived from the original on February 13, 2020. Retrieved April 3, 2016.
- "Selected Social Characteristics in the US – 2006-2010 American Community Survey 5-Year Estimates". US Census Bureau. Archived from the original on February 13, 2020. Retrieved April 3, 2016.
- "Selected Economic Characteristics – 2006-2010 American Community Survey 5-Year Estimates". US Census Bureau. Archived from the original on February 13, 2020. Retrieved April 3, 2016.
- Leip, David. "Atlas of US Presidential Elections". uselectionatlas.org. Retrieved April 13, 2018.
External links
- Richland County, North Dakota
- A history of Richland County and the city of Wahpeton ND (1938?) from the Digital Horizons website
- Richland County maps, Sheet 1 (northern) and Sheet 2 (southern), North Dakota DOT
Places adjacent to Richland County, North Dakota | |
|---|---|
Municipalities and communities of Richland County, North Dakota, United States | ||
|---|---|---|
| Cities | Map of North Dakota highlighting Richland County | |
| Townships | ||
| Unincorporated communities | ||
| Indian reservations | ||
| Footnotes | ‡This populated place also has portions in an adjacent county or counties | |

| Authority control |
|
|---|