Eddy County, North Dakota
Eddy County is a county in the U.S. state of North Dakota. As of the 2010 United States Census, the population was 2,385.[1] Its county seat is New Rockford.[2]
Eddy County | |
|---|---|
 | |
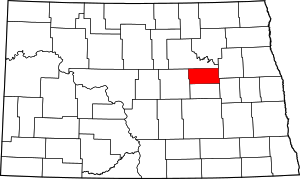 Location within the U.S. state of North Dakota | |
 North Dakota's location within the U.S. | |
| Coordinates: 47°43′N 98°54′W | |
| Country | |
| State | |
| Founded | 1885 |
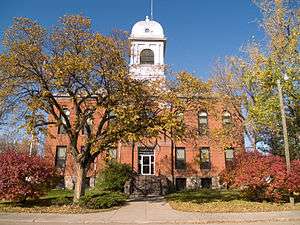
| Seat | New Rockford |
| Largest city | New Rockford |
| Area | |
| • Total | 644 sq mi (1,670 km2) |
| • Land | 630 sq mi (1,600 km2) |
| • Water | 14 sq mi (40 km2) 2.2% |
| Population (2010) | |
| • Total | 2,385 |
| • Estimate (2019) | 2,287 |
| • Density | 3.7/sq mi (1.4/km2) |
| Time zone | UTC−6 (Central) |
| • Summer (DST) | UTC−5 (CDT) |
| Congressional district | At-large |
| Website | Eddy County, North Dakota |
History
The Dakota Territory legislature created the county on March 31, 1885, with territory partitioned from Foster County. It was named for Ezra B. Eddy, a Fargo banker who had died a few weeks earlier. The county government was effected on April 27, 1885.[3][4]
Geography
The Sheyenne River flows easterly through the upper part of the county. The county terrain consists of semi-arid hills, somewhat devoted to agriculture.[5] The terrain slopes to the east and slightly to the north, with its highest point on a hill at the county's SW corner, at 1,562' (476m) ASL.[6] The county has a total area of 644 square miles (1,670 km2), of which 630 square miles (1,600 km2) is land and 14 square miles (36 km2) (2.2%) is water.[7] It is the smallest county in North Dakota by area.
Adjacent counties
- Benson County - north
- Nelson County - northeast
- Griggs County - southeast
- Foster County - south
- Wells County - west
Major highways


County Roads
- Eddy County Road 1
- Eddy County Road 2
- Eddy County Road 3
- Eddy County Road 4
- Eddy County Road 5
- Eddy County Road 6
- Eddy County Road 7
- Eddy County Road 8
- Eddy County Road 9
- Eddy County Road 10
- Eddy County Road 12
- Eddy County Road 14
- Eddy County Road 16
Eddy County Road 14 is a north-south County Road in North Dakota. It runs from North Dakota Highway 15 near New Rockford, North Dakota to Eddy County Road 9 (1st Ave North) in downtown New Rockford. Eddy County Road 9 is an East-West County Road in North Dakota. It runs from US 281/North Dakota Highway 15 (1st Street) in New Rockford, North Dakota to Wells County CR 2 near New Rockford.
National protected area
Demographics
| Historical population | |||
|---|---|---|---|
| Census | Pop. | %± | |
| 1890 | 1,377 | — | |
| 1900 | 3,330 | 141.8% | |
| 1910 | 4,800 | 44.1% | |
| 1920 | 6,493 | 35.3% | |
| 1930 | 6,346 | −2.3% | |
| 1940 | 5,741 | −9.5% | |
| 1950 | 5,372 | −6.4% | |
| 1960 | 4,936 | −8.1% | |
| 1970 | 4,103 | −16.9% | |
| 1980 | 3,554 | −13.4% | |
| 1990 | 2,951 | −17.0% | |
| 2000 | 2,757 | −6.6% | |
| 2010 | 2,385 | −13.5% | |
| Est. 2019 | 2,287 | [8] | −4.1% |
| US Decennial Census[9] 1790-1960[10] 1900-1990[11] 1990-2000[12] 2010-2019[1] | |||
2000 census
As of the 2000 United States Census, there were 2,757 people, 1,164 households, and 743 families residing in the county. The population density was 4 people per square mile (2/km²). There were 1,418 housing units at an average density of 2 per square mile (1/km²). The racial makeup of the county was 96.37% White, 0.07% Black or African American, 2.36% Native American, 0.15% Asian, 0.07% Pacific Islander, 0.25% from other races, and 0.73% from two or more races. 0.62% of the population were Hispanic or Latino of any race. 44.1% were of Norwegian and 32.5% German ancestry.
There were 1,164 households out of which 27.70% had children under the age of 18 living with them, 56.40% were married couples living together, 5.00% had a female householder with no husband present, and 36.10% were non-families. 34.20% of all households were made up of individuals and 20.40% had someone living alone who was 65 years of age or older. The average household size was 2.30 and the average family size was 2.96.
The county population contained 23.60% under the age of 18, 6.10% from 18 to 24, 22.50% from 25 to 44, 23.10% from 45 to 64, and 24.70% who were 65 years of age or older. The median age was 44 years. For every 100 females there were 95.50 males. For every 100 females age 18 and over, there were 92.30 males.
The median income for a household in the county was $28,642, and the median income for a family was $37,625. Males had a median income of $24,063 versus $20,344 for females. The per capita income for the county was $15,941. About 6.90% of families and 9.70% of the population were below the poverty line, including 11.50% of those under age 18 and 11.00% of those age 65 or over.
2010 census
As of the 2010 United States Census, there were 2,385 people, 1,057 households, and 653 families in the county.[13] The population density was 3.8 inhabitants per square mile (1.5/km2). There were 1,323 housing units at an average density of 2.1 per square mile (0.81/km2).[14] The racial makeup of the county was 95.2% white, 2.4% American Indian, 0.3% Asian, 0.2% black or African American, 0.1% Pacific islander, 0.8% from other races, and 1.0% from two or more races. Those of Hispanic or Latino origin made up 2.2% of the population.[13] In terms of ancestry, 52.7% were German, 45.9% were Norwegian, 9.3% were Irish, 6.5% were Swedish, and 1.3% were American.[15]
Of the 1,057 households, 24.2% had children under the age of 18 living with them, 50.9% were married couples living together, 7.4% had a female householder with no husband present, 38.2% were non-families, and 33.9% of all households were made up of individuals. The average household size was 2.18 and the average family size was 2.77. The median age was 49.2 years.[13]
The median income for a household in the county was $38,404 and the median income for a family was $47,857. Males had a median income of $31,887 versus $28,194 for females. The per capita income for the county was $20,302. About 11.5% of families and 15.4% of the population were below the poverty line, including 21.0% of those under age 18 and 21.7% of those age 65 or over.[16]
Communities
Cities
- New Rockford (county seat)
- Sheyenne
Unincorporated communities[5]
- Brantford
- Hamar
Townships
- Bush
- Cherry Lake
- Columbia
- Colvin
- Eddy
- Freeborn
- Gates
- Grandfield
- Hillsdale
- Lake Washington
- Munster
- New Rockford
- Paradise
- Pleasant Prairie
- Rosefield
- Sheldon
- Superior
- Tiffany
Politics
Eddy County voters tend to vote Republican. In 71% percent of the national elections since 1960, the county selected the Republican Party candidate.
| Year | Republican | Democratic | Third parties |
|---|---|---|---|
| 2016 | 64.3% 791 | 28.8% 355 | 6.9% 85 |
| 2012 | 54.8% 634 | 42.0% 486 | 3.2% 37 |
| 2008 | 47.0% 548 | 50.0% 583 | 2.9% 34 |
| 2004 | 54.0% 655 | 44.0% 534 | 2.0% 24 |
| 2000 | 55.4% 703 | 36.1% 458 | 8.4% 107 |
| 1996 | 40.4% 517 | 43.2% 553 | 16.5% 211 |
| 1992 | 36.6% 591 | 35.6% 575 | 27.8% 449 |
| 1988 | 53.7% 891 | 45.1% 748 | 1.2% 19 |
| 1984 | 56.4% 1,049 | 42.8% 796 | 0.8% 15 |
| 1980 | 61.2% 1,153 | 28.6% 539 | 10.1% 191 |
| 1976 | 43.3% 890 | 54.7% 1,123 | 2.0% 41 |
| 1972 | 52.0% 1,022 | 46.4% 911 | 1.6% 31 |
| 1968 | 51.1% 1,018 | 44.8% 893 | 4.1% 81 |
| 1964 | 35.8% 747 | 64.0% 1,337 | 0.2% 4 |
| 1960 | 50.7% 1,188 | 49.2% 1,152 | 0.1% 2 |
| 1956 | 56.0% 1,239 | 44.0% 973 | |
| 1952 | 67.1% 1,534 | 31.8% 728 | 1.1% 26 |
| 1948 | 46.9% 952 | 45.2% 919 | 7.9% 161 |
| 1944 | 47.6% 974 | 50.9% 1,042 | 1.6% 32 |
| 1940 | 48.4% 1,319 | 50.2% 1,368 | 1.4% 37 |
| 1936 | 21.4% 579 | 63.8% 1,729 | 14.9% 403 |
| 1932 | 21.3% 537 | 74.7% 1,888 | 4.0% 102 |
| 1928 | 46.1% 1,071 | 53.4% 1,240 | 0.5% 11 |
| 1924 | 39.3% 881 | 4.5% 101 | 56.2% 1,258 |
| 1920 | 68.8% 1,525 | 26.0% 577 | 5.2% 116 |
| 1916 | 40.2% 505 | 51.8% 650 | 8.0% 101 |
| 1912 | 21.9% 199 | 41.3% 376 | 36.8% 335 |
| 1908 | 58.0% 540 | 39.5% 368 | 2.5% 23 |
| 1904 | 76.2% 596 | 20.7% 162 | 3.1% 24 |
| 1900 | 64.5% 455 | 33.3% 235 | 2.3% 16 |
References
- "State & County QuickFacts". United States Census Bureau. Archived from the original on June 7, 2011. Retrieved October 31, 2013.
- "Find a County". National Association of Counties. Archived from the original on July 4, 2012. Retrieved June 7, 2011.
- "County History". Official Portal for North Dakota State Government. Archived from the original on February 2, 2015. Retrieved May 4, 2011.
- "Dakota Territory, South Dakota, and North Dakota: Individual County Chronologies". Dakota Territory Atlas of Historical County Boundaries. The Newberry Library. 2006. Retrieved February 3, 2015.
- Eddy County ND Google Maps (accessed February 17, 2019)
- ""Find an Altitude/Eddy County ND" Google Maps (accessed February 17, 2019)". Archived from the original on May 21, 2019. Retrieved February 18, 2019.
- "2010 Census Gazetteer Files". US Census Bureau. August 22, 2012. Archived from the original on January 29, 2015. Retrieved January 28, 2015.
- "Population and Housing Unit Estimates". Retrieved April 6, 2020.
- "US Decennial Census". US Census Bureau. Retrieved January 28, 2015.
- "Historical Census Browser". University of Virginia Library. Retrieved January 28, 2015.
- Forstall, Richard L., ed. (March 27, 1995). "Population of Counties by Decennial Census: 1900 to 1990". US Census Bureau. Retrieved January 28, 2015.
- "Census 2000 PHC-T-4. Ranking Tables for Counties: 1990 and 2000" (PDF). US Census Bureau. April 2, 2001. Retrieved January 28, 2015.
- "Profile of General Population and Housing Characteristics: 2010 Demographic Profile Data". US Census Bureau. Archived from the original on February 13, 2020. Retrieved March 14, 2016.
- "Population, Housing Units, Area, and Density: 2010 - County". US Census Bureau. Archived from the original on February 13, 2020. Retrieved March 14, 2016.
- "Selected Social Characteristics in the US – 2006-2010 American Community Survey 5-Year Estimates". US Census Bureau. Archived from the original on February 13, 2020. Retrieved March 14, 2016.
- "DP03 Selected Economic Characteristics – 2006-2010 American Community Survey 5-Year Estimates". US Census Bureau. Archived from the original on February 13, 2020. Retrieved March 14, 2016.
- Leip, David. "Atlas of US Presidential Elections". uselectionatlas.org. Retrieved April 12, 2018.
External links
Places adjacent to Eddy County, North Dakota | ||||||||||
|---|---|---|---|---|---|---|---|---|---|---|
| ||||||||||
Municipalities and communities of Eddy County, North Dakota, United States | ||
|---|---|---|
| Cities | Map of North Dakota highlighting Eddy County | |
| Townships |
| |
| Unincorporated communities |
| |

| Authority control |
|
|---|