Pierce County, North Dakota
Pierce County is a county in the U.S. state of North Dakota. As of the 2010 United States Census, the population was 4,357.[1] Its county seat is Rugby.[2]
Pierce County | |
|---|---|
 | |
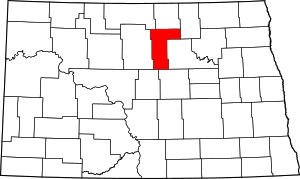 Location within the U.S. state of North Dakota | |
 North Dakota's location within the U.S. | |
| Coordinates: 48°15′N 99°59′W | |
| Country | |
| State | |
| Founded | March 11, 1887 (created) April 6, 1889 (organized) |
| Named for | Gilbert A. Pierce |
| Seat | Rugby |
| Largest city | Rugby |
| Area | |
| • Total | 1,082 sq mi (2,800 km2) |
| • Land | 1,019 sq mi (2,640 km2) |
| • Water | 64 sq mi (170 km2) 5.9% |
| Population (2010) | |
| • Total | 4,357 |
| • Estimate (2019) | 3,975 |
| • Density | 4.0/sq mi (1.6/km2) |
| Time zone | UTC−6 (Central) |
| • Summer (DST) | UTC−5 (CDT) |
| Congressional district | At-large |
| Website | www |
History
The Dakota Territory legislature created the county on March 11, 1887, with areas partitioned from Bottineau, Rolette, McHenry and the now-extinct DeSmet counties. It was named for Gilbert A. Pierce, a Dakotas political figure. The county was not organized at that time, nor was it attached to another county for administrative or judicial purposes. It was attached to McHenry County on February 4, 1889, but that lasted only two months; on April 6 the county government was effected and the attachment to McHenry was terminated.
The county's boundaries were enlarged on November 8, 1892, when Church County was dissolved and a portion of its territory was annexed into Pierce.[3][4]
The geographical center of North America is in Pierce County, about 6 miles (10 km) west of Balta.[5] Rugby has a monument for the center at the intersection of US 2 and ND 3.
Geography
The North Fork of the Sheyenne River flows easterly through central Pierce County. The county terrain consists of rolling hills, mostly devoted to agriculture.[6] The terrain generally slopes to the north and east, with its highest point a hill near the SW county corner, at 1,634' (498m) ASL.[7] The county has a total area of 1,082 square miles (2,800 km2), of which 1,019 square miles (2,640 km2) is land and 64 square miles (170 km2) (5.9%) is water.[8]
Major highways


Adjacent counties
- Rolette County - north
- Towner County - northeast
- Benson County - east
- Wells County - southeast
- Sheridan County - southwest
- McHenry County - west
- Bottineau County - northwest
Protected areas[6]
- Boyer National Wildlife Refuge
- Buffalo Lake National Wildlife Refuge
- Hurricane Lake National Wildlife Refuge
- Meyer Township National Wildlife Refuge
Lakes[6]
- Antelope Lakes
- Aylmer Lake (part)
- Battema Lake
- Buffalo Lake
- Clear Lake
- Davis Lake
- Girard Lake
- Goose Lake
- Gunderson Lake
- Guss Lake
- Horseshoe Lake
- Kilgore Lake
- Lesmeister Lake
- Long Lake
- Petrified Lake
- Ranch Lake
- Round Lake
- Sand Lake
- Smoky Lake (part)
- Twin Lakes (part)
Demographics
| Historical population | |||
|---|---|---|---|
| Census | Pop. | %± | |
| 1890 | 905 | — | |
| 1900 | 4,765 | 426.5% | |
| 1910 | 9,740 | 104.4% | |
| 1920 | 9,283 | −4.7% | |
| 1930 | 9,074 | −2.3% | |
| 1940 | 9,208 | 1.5% | |
| 1950 | 8,326 | −9.6% | |
| 1960 | 7,394 | −11.2% | |
| 1970 | 6,323 | −14.5% | |
| 1980 | 6,166 | −2.5% | |
| 1990 | 5,052 | −18.1% | |
| 2000 | 4,675 | −7.5% | |
| 2010 | 4,357 | −6.8% | |
| Est. 2019 | 3,975 | [9] | −8.8% |
| US Decennial Census[10] 1790-1960[11] 1900-1990[12] 1990-2000[13] 2010-2019[1] | |||
2000 census
As of the 2000 United States Census, there were 4,675 people, 1,964 households, and 1,276 families in the county. The population density was 4.59/sqmi (1.77/km²). There were 2,269 housing units at an average density of 2.23/sqmi (0.86/km²). The racial makeup of the county was 98.50% White, 0.11% Black or African American, 0.68% Native American, 0.26% Asian, 0.04% from other races, and 0.41% from two or more races. 0.60% of the population were Hispanic or Latino of any race. 47.7% were of German and 32.7% Norwegian ancestry.
There were 1,964 households out of which 28.20% had children under the age of 18 living with them, 56.40% were married couples living together, 6.30% had a female householder with no husband present, and 35.00% were non-families. 32.00% of all households were made up of individuals and 17.10% had someone living alone who was 65 years of age or older. The average household size was 2.31 and the average family size was 2.94.
The county population contained 23.90% under the age of 18, 5.50% from 18 to 24, 23.90% from 25 to 44, 22.70% from 45 to 64, and 24.10% who were 65 years of age or older. The median age was 43 years. For every 100 females there were 96.60 males. For every 100 females age 18 and over, there were 92.50 males.
The median income for a household in the county was $26,524, and the median income for a family was $34,412. Males had a median income of $25,037 versus $16,946 for females. The per capita income for the county was $14,055. About 9.30% of families and 12.50% of the population were below the poverty line, including 12.40% of those under age 18 and 17.00% of those age 65 or over.
2010 census
As of the 2010 census, there were 4,357 people, 1,835 households, and 1,145 families in the county.[14] The population density was 4.28/sqmi (1.65/km²). There were 2,199 housing units at an average density of 2.16/sqmi (0.83/km²).[15] The racial makeup of the county was 94.1% white, 3.9% American Indian, 0.5% black or African American, 0.1% Asian, 0.7% from other races, and 0.8% from two or more races. Those of Hispanic or Latino origin made up 1.0% of the population.[14] In terms of ancestry, 52.3% were German, 34.5% were Norwegian, 5.5% were Irish, and 2.0% were American.[16]
Of the 1,835 households, 24.5% had children under the age of 18 living with them, 52.8% were married couples living together, 5.9% had a female householder with no husband present, 37.6% were non-families, and 34.3% of all households were made up of individuals. The average household size was 2.23 and the average family size was 2.86. The median age was 46.9 years.[14]
The median income for a household in the county was $37,091 and the median income for a family was $55,304. Males had a median income of $39,511 versus $21,811 for females. The per capita income for the county was $18,575. About 6.4% of families and 12.9% of the population were below the poverty line, including 11.2% of those under age 18 and 19.2% of those age 65 or over.[17]
Communities
Unincorporated communities[6]
- Leverich
- Silva
- Tunbridge
Townships
- Alexanter
- Antelope Lake
- Balta
- Elling
- Elverum
- Hagel
- Jefferson
- Meyer
- Ness
- Reno Valley
- Rush Lake
- Torgerson
- Truman
- Tuscarora
- White
Politics
Pierce County voters have tended to vote Republican for decades. In only one national election since 1964 has the county selected the Democratic Party candidate (as of 2016).
| Year | Republican | Democratic | Third parties |
|---|---|---|---|
| 2016 | 69.4% 1,437 | 20.8% 431 | 9.8% 203 |
| 2012 | 67.3% 1,465 | 30.3% 660 | 2.4% 53 |
| 2008 | 60.8% 1,301 | 37.0% 792 | 2.2% 46 |
| 2004 | 67.2% 1,475 | 31.3% 686 | 1.6% 34 |
| 2000 | 68.4% 1,348 | 25.4% 500 | 6.2% 123 |
| 1996 | 51.5% 1,017 | 34.0% 671 | 14.5% 286 |
| 1992 | 45.2% 1,099 | 31.3% 761 | 23.5% 571 |
| 1988 | 57.4% 1,422 | 40.7% 1,008 | 1.9% 47 |
| 1984 | 71.7% 1,883 | 26.3% 691 | 2.0% 52 |
| 1980 | 76.1% 2,273 | 17.3% 517 | 6.6% 198 |
| 1976 | 48.4% 1,396 | 49.7% 1,434 | 2.0% 57 |
| 1972 | 66.2% 1,970 | 32.7% 973 | 1.2% 35 |
| 1968 | 57.1% 1,700 | 35.2% 1,048 | 7.8% 231 |
| 1964 | 38.3% 1,178 | 61.6% 1,893 | 0.1% 2 |
| 1960 | 44.2% 1,464 | 55.8% 1,848 | 0.0% 1 |
| 1956 | 59.8% 1,997 | 40.1% 1,340 | 0.2% 5 |
| 1952 | 77.8% 2,806 | 21.4% 773 | 0.8% 29 |
| 1948 | 58.9% 1,738 | 38.8% 1,147 | 2.3% 68 |
| 1944 | 60.1% 1,992 | 39.4% 1,307 | 0.5% 17 |
| 1940 | 61.6% 2,349 | 38.1% 1,451 | 0.3% 11 |
| 1936 | 24.2% 912 | 57.6% 2,168 | 18.2% 684 |
| 1932 | 25.7% 856 | 73.2% 2,439 | 1.1% 38 |
| 1928 | 47.6% 1,469 | 52.0% 1,606 | 0.4% 11 |
| 1924 | 46.9% 1,160 | 6.4% 157 | 46.8% 1,157 |
| 1920 | 84.6% 2,102 | 11.8% 294 | 3.6% 89 |
| 1916 | 44.3% 703 | 49.7% 789 | 6.1% 96 |
| 1912 | 22.4% 264 | 38.4% 453 | 39.2% 462[19] |
| 1908 | 57.4% 884 | 39.6% 610 | 3.1% 47 |
| 1904 | 73.4% 921 | 22.6% 284 | 4.0% 50 |
| 1900 | 64.9% 535 | 33.5% 276 | 1.6% 13 |
References
- "State & County QuickFacts". United States Census Bureau. Archived from the original on July 28, 2011. Retrieved November 1, 2013.
- "Find a County". National Association of Counties. Retrieved June 7, 2011.
- "County History". Official Portal for North Dakota State Government. Archived from the original on February 2, 2015. Retrieved May 4, 2011.
- "Dakota Territory, South Dakota, and North Dakota: Individual County Chronologies". Dakota Territory Atlas of Historical County Boundaries. The Newberry Library. 2006. Retrieved February 4, 2015.
- MacPherson, James (June 2, 2010). "N.D. town misses mark as North America's center". USA Today. Retrieved April 15, 2014.
- Pierce County ND Google Maps (accessed 26 February 2019)
- ""Find an Altitude/Pierce County ND" Google Maps (accessed 26 February 2019)". Archived from the original on May 21, 2019. Retrieved February 26, 2019.
- "2010 Census Gazetteer Files". US Census Bureau. August 22, 2012. Archived from the original on January 29, 2015. Retrieved February 1, 2015.
- "Population and Housing Unit Estimates". Retrieved April 3, 2020.
- "US Decennial Census". US Census Bureau. Retrieved February 1, 2015.
- "Historical Census Browser". University of Virginia Library. Retrieved February 1, 2015.
- Forstall, Richard L., ed. (April 20, 1995). "Population of Counties by Decennial Census: 1900 to 1990". US Census Bureau. Retrieved February 1, 2015.
- "Census 2000 PHC-T-4. Ranking Tables for Counties: 1990 and 2000" (PDF). US Census Bureau. April 2, 2001. Retrieved February 1, 2015.
- "Profile of General Population and Housing Characteristics: 2010 Demographic Profile Data". US Census Bureau. Archived from the original on February 13, 2020. Retrieved April 3, 2016.
- "Population, Housing Units, Area, and Density: 2010 - County". US Census Bureau. Archived from the original on February 13, 2020. Retrieved April 3, 2016.
- "Selected Social Characteristics in the US – 2006-2010 American Community Survey 5-Year Estimates". US Census Bureau. Archived from the original on February 13, 2020. Retrieved April 3, 2016.
- "Selected Economic Characteristics – 2006-2010 American Community Survey 5-Year Estimates". US Census Bureau. Archived from the original on February 13, 2020. Retrieved April 3, 2016.
- Leip, David. "Atlas of US Presidential Elections". uselectionatlas.org. Retrieved April 13, 2018.
- The leading "other" candidate, Progressive Theodore Roosevelt, received 276 votes, while Socialist Eugene Debs received 159 votes, Prohibition candidate Eugene Chafin received 27 votes.
External links
- A history of Pierce County (1936) from the Digital Horizons website
- Fifty years in Pierce county (1943) from the Digital Horizons website
- Pierce County maps, Sheet 1 (northern) and Sheet 2 (southern), North Dakota DOT
Places adjacent to Pierce County, North Dakota | ||||||||||
|---|---|---|---|---|---|---|---|---|---|---|
| ||||||||||
Municipalities and communities of Pierce County, North Dakota, United States | ||
|---|---|---|
| Cities | Map of North Dakota highlighting Pierce County | |
| Townships |
| |
| CDPs | ||
| Unorganized territories |
| |
| Unincorporated communities |
| |

| Authority control |
|
|---|