Dunn County, North Dakota
Dunn County is a county in the U.S. state of North Dakota. As of the 2010 United States Census, the population was 3,536.[1] Its county seat is Manning.[2]
Dunn County | |
|---|---|
 Dunn County Courthouse - Manning, North Dakota | |
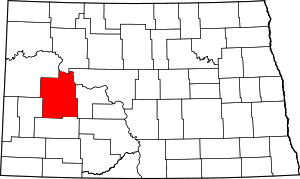 Location within the U.S. state of North Dakota | |
 North Dakota's location within the U.S. | |
| Coordinates: 47°22′N 102°37′W | |
| Country | |
| State | |
| Founded | March 9, 1883 (created) January 18, 1908 (organized) |
| Seat | Manning |
| Largest city | Killdeer |
| Area | |
| • Total | 2,082 sq mi (5,390 km2) |
| • Land | 2,008 sq mi (5,200 km2) |
| • Water | 74 sq mi (190 km2) 3.5% |
| Population (2010) | |
| • Total | 3,536 |
| • Estimate (2019) | 4,424 |
| • Density | 1.7/sq mi (0.66/km2) |
| Time zones | |
| (northern portion) | UTC−6 (Central) |
| • Summer (DST) | UTC−5 (CDT) |
| (southern portion) | UTC−7 (Mountain) |
| • Summer (DST) | UTC−6 (MDT) |
| Website | www |
History
On March 9, 1883 the Dakota Territory legislature authorized the creation of a new county, using territory partitioned from Howard County (which is now extinct). The county organization was not effected at that time, but the county was not attached to another county for judicial purposes.
The county boundaries were altered in 1883, and on November 3, 1896 the legislature ordered Dunn dissolved, with its territory assigned to Stark County. However, the state supreme court overturned the legislature's act on May 24, 1901; in effect re-creating Dunn County. The county was still not assigned to another county. This was resolved on March 10, 1903, when the county was assigned to Stark County for judicial purposes.
On March 13, 1903 the legislature again voted to dissolve Dunn County, but again (during the 1905 session) the state supreme court voided the act. Dunn County continued to be attached to Stark County. However, on January 18, 1908, the county organization was effected, and Dunn became a standalone county. In the process, Dunn gained a tract of previously-unattached land from Stark County, enlarging its boundary. The configuration thus created has remained to the present. The county was named for John Piatt Dunn,[3] who opened the first drugstore in North Dakota, and who was a civic and commercial leader during the early history of Bismarck.[4][5]
Geography
The Missouri River flows southeasterly along the northeastern boundary of Dunn County, and the Little Missouri River flows eastward across the center part of the county, to its confluence with the Missouri in the NE part of the county. The county terrain consists of semi-arid rolling hills, which are etched in the north and east by gullies and drainages to the river valleys.[6] The terrain slopes to the east and north; its highest point is a hill at SW corner, at 2,625' (800m) ASL.[7] The county has a total area of 2,082 square miles (5,390 km2), of which 2,008 square miles (5,200 km2) is land and 74 square miles (190 km2) (3.5%) is water.[8] It is the fifth-largest county in North Dakota by total area.
Dunn County is somewhat unusual among western North Dakota counties. Like other counties in the region, it has both prairie and badlands areas. Located in the northwest part of the county are the Killdeer Mountains, which are more accurately described as hills. These hills help create a mini-ecosystem on the southern edge of the Little Missouri badlands, which has a greater abundance of aspen forests and wildlife than is typically found in southwestern North Dakota.
The northwest corner of the county, northwest of the Killdeer Mountains, features many square miles of bur oak forest, mainly on the north-facing slopes of the hills. Bur oak and quaking aspen, though native to North Dakota, are sparse in western North Dakota, with Dunn County being a notable exception.
Adjacent counties
- Mountrail County – north
- McLean County – northeast
- Mercer County – east
- Stark County – south
- Billings County – southwest
- McKenzie County – northwest
Protected areas[6]
- Lake Ilo National Wildlife Refuge
- Little Missouri Public Use Area
- Kildeer Mountain State Game Preserve
- Badlands Trail Rides
- Little Mountain State Park
Lakes[6]
- Moffet Slough
Demographics
| Historical population | |||
|---|---|---|---|
| Census | Pop. | %± | |
| 1890 | 159 | — | |
| 1910 | 5,302 | — | |
| 1920 | 8,828 | 66.5% | |
| 1930 | 9,566 | 8.4% | |
| 1940 | 8,376 | −12.4% | |
| 1950 | 7,212 | −13.9% | |
| 1960 | 6,350 | −12.0% | |
| 1970 | 4,895 | −22.9% | |
| 1980 | 4,627 | −5.5% | |
| 1990 | 4,005 | −13.4% | |
| 2000 | 3,600 | −10.1% | |
| 2010 | 3,536 | −1.8% | |
| Est. 2019 | 4,424 | [9] | 25.1% |
| US Decennial Census[10] 1790-1960[11] 1900-1990[12] 1990-2000[13] 2010-2019[1] | |||
2000 census
As of the 2000 United States Census, there were 3,600 people, 1,378 households, and 986 families in the county. The population density was 2 people per square mile (1/km²). There were 1,965 housing units at an average density of 0.98 per square mile (0.38/km²). The racial makeup of the county was 86.58% White, 0.03% Black or African American, 12.44% Native American, 0.08% Asian, and 0.86% from two or more races. 0.75% of the population were Hispanic or Latino of any race. 43.2% were of German and 16.6% Norwegian ancestry.
There were 1,378 households out of which 32.00% had children under the age of 18 living with them, 60.30% were married couples living together, 7.20% had a female householder with no husband present, and 28.40% were non-families. 25.30% of all households were made up of individuals and 12.30% had someone living alone who was 65 years of age or older. The average household size was 2.57 and the average family size was 3.11.
The county population contained 27.40% under the age of 18, 5.80% from 18 to 24, 23.60% from 25 to 44, 25.90% from 45 to 64, and 17.40% who were 65 years of age or older. The median age was 41 years. For every 100 females there were 104.20 males. For every 100 females age 18 and over, there were 103.60 males.
The median income for a household in the county was $30,015, and the median income for a family was $34,405. Males had a median income of $26,226 versus $17,143 for females. The per capita income for the county was $14,624. About 13.80% of families and 17.50% of the population were below the poverty line, including 21.70% of those under age 18 and 14.20% of those age 65 or over.
2010 census
As of the 2010 United States Census, there were 3,536 people, 1,401 households, and 977 families in the county.[14] The population density was 1.8 inhabitants per square mile (0.69/km2). There were 2,132 housing units at an average density of 1.1 per square mile (0.42/km2).[15] The racial makeup of the county was 84.9% white, 12.7% American Indian, 0.3% Asian, 0.2% black or African American, 0.2% from other races, and 1.7% from two or more races. Those of Hispanic or Latino origin made up 1.1% of the population.[14] In terms of ancestry, 57.6% were German, 20.3% were Norwegian, 8.5% were Czech, 6.0% were Russian, 5.7% were Irish, 5.3% were English, and 1.8% were American.[16]
Of the 1,401 households, 28.1% had children under the age of 18 living with them, 57.7% were married couples living together, 6.6% had a female householder with no husband present, 30.3% were non-families, and 26.5% of all households were made up of individuals. The average household size was 2.43 and the average family size was 2.93. The median age was 44.4 years.[14]
The median income for a household in the county was $48,707 and the median income for a family was $65,122. Males had a median income of $37,270 versus $23,599 for females. The per capita income for the county was $24,832. About 6.2% of families and 8.6% of the population were below the poverty line, including 7.5% of those under age 18 and 12.1% of those age 65 or over.[17]
Sites of interest
- Killdeer Mountains
- Killdeer Mountain National Battlefield
Communities
Cities
Census-designated place
- Manning (county seat)
Unincorporated communities[6]
- Emerson
- Fayette
- Hirschville
- Marshall
- Medicine Hole
- New Hradec
- Twin Buttes
- Werner
Politics
Dunn County has voted Republican in every election since 1976.
| Year | Republican | Democratic | Third parties |
|---|---|---|---|
| 2016 | 79.0% 1,771 | 16.0% 358 | 5.1% 114 |
| 2012 | 74.0% 1,506 | 25.0% 508 | 1.0% 20 |
| 2008 | 65.7% 1,080 | 32.1% 527 | 2.3% 37 |
| 2004 | 66.4% 1,178 | 32.2% 571 | 1.4% 25 |
| 2000 | 65.1% 1,124 | 27.4% 474 | 7.5% 130 |
| 1996 | 47.6% 830 | 33.7% 587 | 18.7% 326 |
| 1992 | 37.2% 784 | 31.7% 667 | 31.1% 654 |
| 1988 | 58.0% 1,263 | 41.0% 892 | 1.1% 23 |
| 1984 | 68.1% 1,583 | 30.8% 716 | 1.1% 25 |
| 1980 | 71.5% 1,706 | 22.3% 532 | 6.2% 148 |
| 1976 | 48.3% 1,041 | 48.7% 1,051 | 3.0% 65 |
| 1972 | 65.5% 1,438 | 29.3% 644 | 5.2% 115 |
| 1968 | 56.2% 1,207 | 35.9% 772 | 7.9% 170 |
| 1964 | 44.4% 1,079 | 55.6% 1,351 | 0.1% 2 |
| 1960 | 52.5% 1,462 | 47.5% 1,321 | |
| 1956 | 59.6% 1,567 | 40.1% 1,055 | 0.2% 6 |
| 1952 | 76.5% 2,237 | 22.7% 664 | 0.8% 23 |
| 1948 | 51.3% 1,244 | 44.3% 1,074 | 4.3% 105 |
| 1944 | 59.8% 1,374 | 40.0% 919 | 0.2% 5 |
| 1940 | 60.3% 2,132 | 39.4% 1,392 | 0.3% 12 |
| 1936 | 21.7% 732 | 66.8% 2,257 | 11.6% 392 |
| 1932 | 18.9% 569 | 79.1% 2,380 | 2.0% 59 |
| 1928 | 46.5% 1,360 | 53.4% 1,561 | 0.1% 4 |
| 1924 | 42.8% 980 | 8.3% 190 | 48.9% 1,121 |
| 1920 | 80.6% 2,102 | 17.5% 457 | 1.9% 49 |
| 1916 | 34.4% 566 | 62.5% 1,028 | 3.0% 50 |
| 1912 | 32.4% 285 | 28.0% 246 | 39.7% 349 |
| 1908 | 68.8% 373 | 29.5% 160 | 1.7% 9 |
References
- "State & County QuickFacts". United States Census Bureau. Archived from the original on June 7, 2011. Retrieved October 31, 2013.
- "Find a County". National Association of Counties. Archived from the original on July 4, 2012. Retrieved June 7, 2011.
- Gannett, Henry (1905). The Origin of Certain Place Names in the United States. Govt. Print. Off. p. 110.
- "County History". Official Portal for North Dakota State Government. Archived from the original on February 2, 2015. Retrieved May 4, 2011.
- "Dakota Territory, South Dakota, and North Dakota: Individual County Chronologies". Dakota Territory Atlas of Historical County Boundaries. The Newberry Library. 2006. Retrieved February 3, 2015.
- Dunn County ND Google Maps (accessed 17 February 2019)
- ""Find an Altitude/Dunn County ND" Google Maps (accessed 17 February 2019)". Archived from the original on May 21, 2019. Retrieved February 18, 2019.
- "2010 Census Gazetteer Files". US Census Bureau. August 22, 2012. Archived from the original on January 29, 2015. Retrieved January 28, 2015.
- "Population and Housing Unit Estimates". Retrieved April 2, 2020.
- "US Decennial Census". US Census Bureau. Retrieved January 28, 2015.
- "Historical Census Browser". University of Virginia Library. Retrieved January 28, 2015.
- Forstall, Richard L., ed. (March 27, 1995). "Population of Counties by Decennial Census: 1900 to 1990". US Census Bureau. Retrieved January 28, 2015.
- "Census 2000 PHC-T-4. Ranking Tables for Counties: 1990 and 2000" (PDF). US Census Bureau. April 2, 2001. Retrieved January 28, 2015.
- "Profile of General Population and Housing Characteristics: 2010 Demographic Profile Data". US Census Bureau. Archived from the original on February 13, 2020. Retrieved March 14, 2016.
- "Population, Housing Units, Area, and Density: 2010 - County". US Census Bureau. Archived from the original on February 13, 2020. Retrieved March 14, 2016.
- "Selected Social Characteristics in the US – 2006-2010 American Community Survey 5-Year Estimates". US Census Bureau. Archived from the original on February 13, 2020. Retrieved March 14, 2016.
- "Selected Economic Characteristics – 2006-2010 American Community Survey 5-Year Estimates". US Census Bureau. Archived from the original on February 13, 2020. Retrieved March 14, 2016.
- Leip, David. "Atlas of US Presidential Elections". uselectionatlas.org. Retrieved April 12, 2018.
External links
- Killdeer Mountain Scenic Byway
- Little Missouri State Park
- Dunn County maps, Sheet 1 (northern) and Sheet 2 (southern), North Dakota DOT
Places adjacent to Dunn County, North Dakota | ||||||||||
|---|---|---|---|---|---|---|---|---|---|---|
| ||||||||||
Municipalities and communities of Dunn County, North Dakota, United States | ||
|---|---|---|
| Cities | Map of North Dakota highlighting Dunn County | |
| CDP | ||
| Unorganized territories |
| |
| Unincorporated communities |
| |

| Authority control |
|
|---|