Walsh County, North Dakota
Walsh County is a county in the U.S. state of North Dakota. As of the 2010 United States Census, the population was 11,119.[1] Its county seat is Grafton.[2]
Walsh County | |
|---|---|
 | |
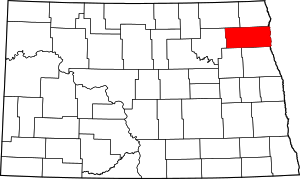 Location within the U.S. state of North Dakota | |
 North Dakota's location within the U.S. | |
| Coordinates: 48°22′N 97°43′W | |
| Country | |
| State | |
| Founded | May 2, 1881 (created) August 30, 1881 (organized) |
| Named for | George H. Walsh |
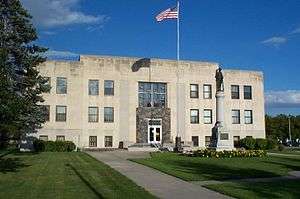
| Seat | Grafton |
| Largest city | Grafton |
| Area | |
| • Total | 1,294 sq mi (3,350 km2) |
| • Land | 1,282 sq mi (3,320 km2) |
| • Water | 12 sq mi (30 km2) 0.9% |
| Population (2010) | |
| • Total | 11,119 |
| • Estimate (2019) | 10,641 |
| • Density | 8.6/sq mi (3.3/km2) |
| Time zone | UTC−6 (Central) |
| • Summer (DST) | UTC−5 (CDT) |
| Congressional district | At-large |
| Website | www |
History
The Dakota Territory legislature created the county on May 2, 1881, with areas partitioned from Grand and Pembina counties. It was organized on August 30 of that same year, with Grafton as county seat.[3][4] It was named for George H. Walsh (1845–1913), a newspaperman and politician in Grand Forks.
Geography
Walsh County lies on the east side of North Dakota. Its east boundary line abuts the west boundary line of the state of Minnesota (across the Red River). The Red River flows north along the east side of the county on its way to the Hudson Bay in Canada. The south branch of the Park River flows easterly through the county to discharge into the Red on the east side of the county.[5] The terrain generally slopes to the north and east, but the highest point is its NW corner, at 1,647' (502m) ASL.[6] The county has a total area of 1,294 square miles (3,350 km2), of which 1,282 square miles (3,320 km2) is land and 12 square miles (31 km2) (0.9%) is water.[7]
Major highways
Adjacent counties
- Pembina County – north
- Kittson County, Minnesota – northeast
- Marshall County, Minnesota – east
- Grand Forks County – south
- Nelson County – southwest
- Ramsey County – west
- Cavalier County – northwest
Protected areas
- Ardoch National Wildlife Refuge
- Fairdale Slough National Waterfowl Production Area
- National Waterfowl Production Area
- North Salt Lake State Game Management Area
Lakes[5]
- Fairdale Slough
- Homme Lake
- North Salt Lake
- Salt Lake
- Waterloo Lake
Demographics
| Historical population | |||
|---|---|---|---|
| Census | Pop. | %± | |
| 1890 | 16,587 | — | |
| 1900 | 20,288 | 22.3% | |
| 1910 | 19,491 | −3.9% | |
| 1920 | 19,087 | −2.1% | |
| 1930 | 20,047 | 5.0% | |
| 1940 | 20,747 | 3.5% | |
| 1950 | 18,859 | −9.1% | |
| 1960 | 17,997 | −4.6% | |
| 1970 | 16,251 | −9.7% | |
| 1980 | 15,371 | −5.4% | |
| 1990 | 13,840 | −10.0% | |
| 2000 | 12,389 | −10.5% | |
| 2010 | 11,119 | −10.3% | |
| Est. 2019 | 10,641 | [8] | −4.3% |
| US Decennial Census[9] 1790-1960[10] 1900-1990[11] 1990-2000[12] 2010-2019[1] | |||
2000 census
As of the 2000 United States Census, there were 12,389 people, 5,029 households, and 3,319 families in the county. The population density was 9.66/sqmi (3.73/km²). There were 5,757 housing units at an average density of 4.49/sqmi (1.73/km²). The racial makeup of the county was 94.86% White, 0.33% Black or African American, 1.02% Native American, 0.19% Asian, 0.02% Pacific Islander, 2.51% from other races, and 1.07% from two or more races. 5.65% of the population were Hispanic or Latino of any race. 39.7% were of Norwegian, 14.6% German, 8.7% Polish and 8.0% Czech ancestry.
There were 5,029 households out of which 30.60% had children under the age of 18 living with them, 55.10% were married couples living together, 7.50% had a female householder with no husband present, and 34.00% were non-families. 31.30% of all households were made up of individuals and 15.20% had someone living alone who was 65 years of age or older. The average household size was 2.39 and the average family size was 3.00.
The county population contained 24.90% under the age of 18, 6.50% from 18 to 24, 25.00% from 25 to 44, 24.20% from 45 to 64, and 19.30% who were 65 years of age or older. The median age was 41 years. For every 100 females there were 100.00 males. For every 100 females age 18 and over, there were 96.90 males.
The median income for a household in the county was $33,845, and the median income for a family was $41,619. Males had a median income of $28,080 versus $19,961 for females. The per capita income for the county was $16,496. About 7.70% of families and 10.90% of the population were below the poverty line, including 12.20% of those under age 18 and 8.80% of those age 65 or over.
2010 census
As of the 2010 United States Census, there were 11,119 people, 4,746 households, and 3,021 families in the county.[13] The population density was 8.67/sqmi (3.35/km²). There were 5,498 housing units at an average density of 4.29/sqmi (1.66/km²).[14] The racial makeup of the county was 93.5% white, 1.5% American Indian, 0.3% Asian, 0.2% black or African American, 3.1% from other races, and 1.3% from two or more races. Those of Hispanic or Latino origin made up 8.7% of the population.[13] In terms of ancestry, 39.7% were Norwegian, 21.6% were German, 11.0% were Polish, 9.4% were Irish, 9.3% were Czech, 5.8% were English, and 5.4% were American.[15]
Of the 4,746 households, 25.9% had children under the age of 18 living with them, 52.4% were married couples living together, 7.1% had a female householder with no husband present, 36.3% were non-families, and 32.8% of all households were made up of individuals. The average household size was 2.27 and the average family size was 2.88. The median age was 45.9 years.[13]
The median income for a household in the county was $44,139 and the median income for a family was $58,429. Males had a median income of $36,934 versus $26,826 for females. The per capita income for the county was $23,829. About 5.4% of families and 9.9% of the population were below the poverty line, including 10.8% of those under age 18 and 12.7% of those age 65 or over.[16]
Communities
Cities
Townships
| Range 59 | Range 58 | Range 57 | Range 56 | Range 55 | Range 54 | Range 53 | Range 52 | Range 51 | Range 50 | |
|---|---|---|---|---|---|---|---|---|---|---|
| Township 155 | Sauter | Perth | Cleveland | Medford | Eden | Ops | Forest River | Ardoch | Walshville | Walshville |
| Township 156 | Shepherd | Latona | Norton | Vernon | Rushford | Prairie Centre | Walsh Centre | Harriston | Pulaski | Pulaski |
| Township 157 | Dewey | Adams | Vesta | Golden | Kensington Township | Fertile | Grafton | Oakwood | Acton | Acton |
| Township 158 | St. Andrews | St. Andrews | Martin | Farmington | Glenwood | Dundee | Lampton | Tiber | Silvesta | Kinloss |
Politics
Walsh County voters have traditionally voted Republican. In only one national election since 1964 has the county selected the Democratic Party candidate (as of 2016).
| Year | Republican | Democratic | Third parties |
|---|---|---|---|
| 2016 | 64.6% 2,995 | 25.2% 1,167 | 10.2% 474 |
| 2012 | 55.4% 2,656 | 41.4% 1,985 | 3.1% 150 |
| 2008 | 49.5% 2,415 | 47.6% 2,325 | 2.9% 142 |
| 2004 | 61.6% 3,194 | 36.7% 1,905 | 1.7% 87 |
| 2000 | 59.8% 3,099 | 33.6% 1,743 | 6.6% 340 |
| 1996 | 45.0% 2,222 | 42.2% 2,082 | 12.9% 635 |
| 1992 | 43.1% 2,544 | 32.8% 1,936 | 24.1% 1,424 |
| 1988 | 54.5% 3,250 | 44.4% 2,646 | 1.2% 70 |
| 1984 | 64.8% 4,347 | 33.8% 2,264 | 1.4% 93 |
| 1980 | 64.7% 4,488 | 26.7% 1,850 | 8.7% 600 |
| 1976 | 48.1% 3,518 | 48.6% 3,555 | 3.2% 236 |
| 1972 | 56.3% 3,991 | 41.0% 2,908 | 2.7% 191 |
| 1968 | 50.1% 3,410 | 43.3% 2,948 | 6.7% 454 |
| 1964 | 33.3% 2,454 | 66.6% 4,911 | 0.2% 11 |
| 1960 | 50.2% 4,036 | 49.8% 4,009 | 0.0% 2 |
| 1956 | 54.8% 3,946 | 45.0% 3,238 | 0.2% 16 |
| 1952 | 57.3% 4,761 | 42.1% 3,494 | 0.6% 49 |
| 1948 | 37.6% 2,646 | 59.3% 4,170 | 3.1% 215 |
| 1944 | 34.1% 2,471 | 65.5% 4,747 | 0.5% 34 |
| 1940 | 35.6% 3,051 | 64.2% 5,499 | 0.2% 18 |
| 1936 | 22.2% 1,813 | 70.3% 5,756 | 7.5% 616 |
| 1932 | 22.3% 1,616 | 73.7% 5,342 | 4.0% 286 |
| 1928 | 48.9% 3,657 | 50.8% 3,798 | 0.2% 17 |
| 1924 | 49.2% 2,837 | 15.9% 917 | 34.9% 2,016 |
| 1920 | 67.1% 4,581 | 30.0% 2,047 | 2.9% 196 |
| 1916 | 43.8% 1,670 | 52.5% 2,003 | 3.7% 139 |
| 1912 | 20.3% 586 | 41.9% 1,206 | 37.8% 1,090 |
| 1908 | 49.5% 1,751 | 46.4% 1,641 | 4.2% 148 |
| 1904 | 62.0% 2,042 | 33.8% 1,113 | 4.3% 140 |
| 1900 | 49.4% 1,807 | 49.3% 1,804 | 1.3% 46 |
References
- "State & County QuickFacts". United States Census Bureau. Retrieved November 1, 2013.
- "Find a County". National Association of Counties. Retrieved June 7, 2011.
- "County History". North Dakota.gov. The State of North Dakota. Archived from the original on February 2, 2015. Retrieved February 4, 2015.
- "Dakota Territory, South Dakota, and North Dakota: Individual County Chronologies". Dakota Territory Atlas of Historical County Boundaries. The Newberry Library. 2006. Retrieved February 4, 2015.
- Walsh County ND Google Maps (accessed February 24, 2019)
- ""Find an Altitude/Walsh County ND" Google Maps (accessed February 24, 2019)". Archived from the original on May 21, 2019. Retrieved February 25, 2019.
- "2010 Census Gazetteer Files". US Census Bureau. August 22, 2012. Archived from the original on January 29, 2015. Retrieved February 1, 2015.
- "Population and Housing Unit Estimates". Retrieved March 31, 2020.
- "US Decennial Census". US Census Bureau. Retrieved February 1, 2015.
- "Historical Census Browser". University of Virginia Library. Retrieved February 1, 2015.
- Forstall, Richard L., ed. (April 20, 1995). "Population of Counties by Decennial Census: 1900 to 1990". US Census Bureau. Retrieved February 1, 2015.
- "Census 2000 PHC-T-4. Ranking Tables for Counties: 1990 and 2000" (PDF). US Census Bureau. April 2, 2001. Retrieved February 1, 2015.
- "Profile of General Population and Housing Characteristics: 2010 Demographic Profile Data". US Census Bureau. Archived from the original on February 13, 2020. Retrieved April 3, 2016.
- "Population, Housing Units, Area, and Density: 2010 – County". US Census Bureau. Archived from the original on February 13, 2020. Retrieved April 3, 2016.
- "Selected Social Characteristics in the US – 2006-2010 American Community Survey 5-Year Estimates". US Census Bureau. Archived from the original on February 13, 2020. Retrieved April 3, 2016.
- "Selected Economic Characteristics – 2006-2010 American Community Survey 5-Year Estimates". US Census Bureau. Archived from the original on February 13, 2020. Retrieved April 3, 2016.
- "Earth Point".
- Leip, David. "Atlas of US Presidential Elections". uselectionatlas.org. Retrieved April 13, 2018.
External links
- Walsh County official website
- Walsh County maps, Sheet 1 (western), Sheet 2 (eastern), North Dakota DOT
Places adjacent to Walsh County, North Dakota | ||||||||||
|---|---|---|---|---|---|---|---|---|---|---|
| ||||||||||
Municipalities and communities of Walsh County, North Dakota, United States | ||
|---|---|---|
| Cities | Map of North Dakota highlighting Walsh County | |
| Townships | ||
| CDPs | ||
| Unincorporated communities | ||

| Authority control |
|
|---|