Pembina County, North Dakota
Pembina County is a county in the U.S. state of North Dakota. At the 2010 United States Census its population was 7,413.[1] The county seat is Cavalier.[2]
Pembina County | |
|---|---|
 Pembina County Courthouse before 1920 | |
 Location within the U.S. state of North Dakota | |
 North Dakota's location within the U.S. | |
| Coordinates: 48°46′N 97°33′W | |
| Country | |
| State | |
| Founded | January 9, 1867 (created) August 12, 1867 (organized) |
| Named for | a Chippewa term |
| Seat | Cavalier |
| Largest city | Cavalier |
| Area | |
| • Total | 1,121 sq mi (2,900 km2) |
| • Land | 1,119 sq mi (2,900 km2) |
| • Water | 2.7 sq mi (7 km2) 0.2% |
| Population (2010) | |
| • Total | 7,413 |
| • Estimate (2019) | 6,801 |
| • Density | 6.6/sq mi (2.6/km2) |
| Time zone | UTC−6 (Central) |
| • Summer (DST) | UTC−5 (CDT) |
| Congressional district | At-large |
| Website | www |
History
For thousands of years, various indigenous peoples inhabited the area along the Pembina and Red rivers. At the time of European contact in the 16th century, the dominant tribes were the Assiniboine and the Lakota (or Sioux, as the French colonists called them). The Ojibwe, also known as Chippewa, a branch of the Anishinaabe-speaking language group, gradually migrated west along both sides of the Great Lakes. They developed a long trading relationship with French trappers and colonists. Throughout the Red River of the North area, French trappers married Native American women, and their descendants continued to hunt and trap. A large mixed-race population developed, recognized as an ethnic First Nations group in Canada called the Métis. The Ojibwe and Métis generally supported the French forces during the Seven Years' War in the mid-eighteenth century against Great Britain.
With the British defeat of France and takeover of its colonial territory, the Chippewa learned to deal with a new trading culture. Armed with guns by trading and having adopted the horse from the Mandan and Hidatsa, by the end of the eighteenth century the Chippewa had migrated from woodlands to the Great Plains and begun to push the Lakota west before them. By the time of the War of 1812, the Ojibwe allied with the British against the United States, hoping to forestall European-American settlers' encroaching on their territory. With the settlement of the northern boundary with Canada, the Chippewa within the Dakota Territory were forced to deal with the United States. During the first half of the nineteenth century, the Chippewa had continued conflicts with the Lakota along the Red River, finally pushing them into present-day western North and South Dakota.
Father George Belcourt, a Catholic Jesuit missionary who served them, described their territory in 1849 as the following
We understand here, that the district or department called Pembina, comprises all of the country or basin which is irrigated or traversed by the tributaries of the Red River, south of the line of the 49th parallel of latitude. The prairies' rivers and lakes which extend to the height of land of the Mississippi, and the immense plains which feed innumerable herds of bison to the westward and from which the Chippewa and half breeds [Métis] of this region obtain their subsistence, contains within their limits a country about 400 miles from north to south and more than five hundred miles from east to west.[3]
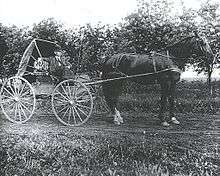
The Métis used two-wheeled ox-drawn carts to transport furs to market along the Red River Trails, between what is now Winnipeg, Canada and Mendota or St. Paul, Minnesota. They also used ox-carts to transport food and shelter during extended buffalo hunts.
Over time, the Ojibwe were persuaded to cede much of their land by treaty to the US, which in turn sold it to homesteaders. They moved to relatively small Indian reservations within their earlier territory.
The precursor to Pembina County was a county of the same name in the Minnesota Territory, extending from the Upper Mississippi River to the western boundary of the territory. When Minnesota became a state in 1858, its western boundary was set at the Red River, and the land to its west was unorganized. A new Pembina County was established as part of the Dakota Territory in 1867. At the time it was a large territory, and in 1871 it was expanded to include much of the territory in what is now eastern North Dakota from Canada to the South Dakota border.
The Dakota Territory legislature created Pembina County on January 9, 1867, from previously unorganized territory. Its government was organized on August 12 of that same year. It was named for a Chippewa term for stab or stabbing.[4] Pembina, the oldest European-American settlement in the future state, was the county seat. In 1911 the seat was relocated to Cavalier.[5][6]
The county boundaries were altered in 1871, 1873, 1881, and 1887. It has retained its present boundaries since 1887. Between 1873 and 1881, eleven new counties were created from Pembina, including Cass County and Grand Forks County. Pembina took its current form in 1887, when Cavalier County was increased in size.[7]
Icelandic State Park is located in Pembina County. The first Icelandic immigrant settlement in present-day North Dakota was in Pembina County in the late 1870s, when a colony of settlers from Iceland moved into the county from the New Iceland homesteads near Lake Winnipeg.[8]
The first Icelandic settlements in what is now North Dakota were established in Pembina County in the late 1870s. Many of the immigrants came from New Iceland near Lake Winnipeg, along with other Icelanders who moved into the area from colonies in Wisconsin. The new settlers lived primarily in the so-called "Icelandic Townships" of Akra, Beaulieu, Gardar, and Thingwalla. The State Historical Society of North Dakota reported fewer than 3 or 4 non-Icelandic families living there in the early 1900s. Evidence of this heritage is found in several township and city names with Icelandic origins. Akra was named after the town of Akranes, near Reykjavík; Gardar was named for Gardar Svavarsson, who was reportedly the first Scandinavian to visit Iceland; and Hallsson was named for an early settler, Johann P. Hallson.[9]
Icelandic State Park was established to preserve evidence of this early pioneer heritage.[10]
Geography
Pembina County lies at the northeast corner of North Dakota. Its north boundary line abuts the south boundary line of Canada and its east boundary line abuts the west boundary line of the state of Minnesota (across the Red River, which flows northward along the county's eastern boundary line). The Pembina River flows easterly through the upper portion of the county, discharging into the Red River near the northeast county corner. The Tongue River flows northeasterly through the upper portion of the county, discharging into the Pembina shortly before the Pembina joins the Red River. The county terrain consists of rolling hills, etched by river drainages. The area is devoted to agriculture.[11] The terrain slopes to the east and north; its highest point is on the lower western boundary line, at 1,302 feet (397 m) above sea level.[12] The county has a total area of 1,121 square miles (2,900 km2), of which 1,119 square miles (2,900 km2) is land and 2.7 square miles (7.0 km2) (0.2%) is water.[13] The lowest point in the state of North Dakota is located on the Red River of the North in Pembina Township in Pembina County, where it flows out of North Dakota and into the Canada–US border of Manitoba.
Major highways
Adjacent counties and rural municipalities
- Rural Municipality of Stanley, Manitoba, Canada - northwest
- Municipality of Rhineland, Manitoba, Canada - north
- Rural Municipality of Montcalm, Manitoba, Canada - northeast
- Kittson County, Minnesota - east
- Marshall County, Minnesota - southeast
- Walsh County - south
- Cavalier County - west
Protected areas[11]
- Frost Fire Ski and Snow Board Area
- Houghton National Wildlife Management Area
- Icelandic State Park
- Juhl National Wildlife Management Area
- McDonald National Wildlife Management Area
- Pembina Gorge State Recreation Area
- Pembina Prairie National Wildlife Management Area
- Tetrault State Forest (part)
Demographics
| Historical population | |||
|---|---|---|---|
| Census | Pop. | %± | |
| 1870 | 1,213 | — | |
| 1880 | 4,862 | 300.8% | |
| 1890 | 14,334 | 194.8% | |
| 1900 | 17,869 | 24.7% | |
| 1910 | 14,749 | −17.5% | |
| 1920 | 15,177 | 2.9% | |
| 1930 | 14,757 | −2.8% | |
| 1940 | 15,671 | 6.2% | |
| 1950 | 13,990 | −10.7% | |
| 1960 | 12,946 | −7.5% | |
| 1970 | 10,728 | −17.1% | |
| 1980 | 10,399 | −3.1% | |
| 1990 | 9,238 | −11.2% | |
| 2000 | 8,585 | −7.1% | |
| 2010 | 7,413 | −13.7% | |
| Est. 2019 | 6,801 | [14] | −8.3% |
| US Decennial Census[15] 1790-1960[16] 1900-1990[17] 1990-2000[18] 2010-2019[1] | |||
2000 census
At the 2000 United States Census,[19] there were 8,585 people, 3,535 households and 2,364 families in the county. The population density was 7.67/sqmi (2.96/km²), with the bulk of the population centered in the cities.[20] Housing density was 3.68/sqmi (1.42/km²) with 4,115 housing units in the county. Racially, the county was predominately White, at more than 95%. There was a small population (1.43%) of Native Americans (1.43%) in the county. African Americans and Asian combined made up less than 1% of the total. 0.21% 1.27% are from other races, and 1.44% from two or more races. Hispanics or Latinos made up a little more than 3% of the population. Early in the county's history, there was an influx of settlers from Iceland. By 2000 the Census Bureau reported that Icelanders made up just 7.9% of the population, third after Norwegian (25.0%) and German (24.0%). French and English and 6.6% ranked fourth and fifth, with 7.9% and 6.6% respectively.
There were 3,535 households of which 29.8% had children under the age of 18 living with them, 58.2% were married couples living together, 5.3% had a female householder with no husband present, and 33.1% were non-families. 30.5% of all households were made up of individuals and 15.7% had someone living alone who was 65 years of age or older. The average household size was 2.38 and the average family size was 2.98. The county population contained 24.9% under age 18, followed by 45- to 64-year-olds (24.8%) and 25- to 44-year-olds (24.6%). Those over the age of 65 were 19.5% of the population, with 18- to 24-year-olds at 6.2%. The median age was 42 years. For every 100 females there were 100.6 males. For every 100 females age 18 and over, there were 100.2 males.[21]
The median household income was $36,430 and the median family income was $45,338. Males had a median income of $30,400 compared with $21,340 for females. The per capita income was $18,692. About 7.4% of families and 9.2% of the population were below the poverty line, including 10.7% of those under age 18 and 9.9% of those age 65 or over.
2010 census
As of the 2010 census, there were 7,413 people, 3,257 households, and 2,069 families in the county.[22] The population density was 6.62/sqmi (2.56/km²). There were 3,859 housing units at an average density of 3.45/sqmi (1.33/km²).[23] The racial makeup of the county was 95.5% white, 1.9% American Indian, 0.3% black or African American, 0.1% Asian, 0.8% from other races, and 1.3% from two or more races. Those of Hispanic or Latino origin made up 2.6% of the population.[22] In terms of ancestry, 33.8% were German, 21.3% were Norwegian, 10.6% were Irish, 9.5% were English, 8.0% were American, and 5.5% were Swedish.[24]
Of the 3,257 households, 24.5% had children under the age of 18 living with them, 54.2% were married couples living together, 5.6% had a female householder with no husband present, 36.5% were non-families, and 32.4% of all households were made up of individuals. The average household size was 2.23 and the average family size was 2.82. The median age was 46.7 years.[22]
The median income for a household in the county was $48,502 and the median income for a family was $61,804. Males had a median income of $40,334 versus $29,662 for females. The per capita income for the county was $27,019. About 4.0% of families and 8.0% of the population were below the poverty line, including 9.5% of those under age 18 and 11.3% of those age 65 or over.[25]
Communities
Cities
Townships
- Advance
- Akra
- Bathgate
- Beaulieu
- Carlisle
- Cavalier
- Crystal
- Drayton
- Elora
- Felson
- Gardar
- Hamilton
- Joliette
- La Moure
- Lincoln
- Lodema
- Midland
- Neche
- Park
- Pembina
- St. Joseph
- St. Thomas
- Thingvalla
- Walhalla
American Indian reservations
Politics
Pembina County voters have traditionally backed the Republican Party. In only one national election since 1948 has the county selected the Democratic Party candidate (as of 2016).
| Year | Republican | Democratic | Third parties |
|---|---|---|---|
| 2016 | 70.0% 2,208 | 21.6% 681 | 8.4% 264 |
| 2012 | 58.3% 1,899 | 38.5% 1,253 | 3.2% 103 |
| 2008 | 52.1% 1,722 | 45.2% 1,494 | 2.8% 91 |
| 2004 | 64.0% 2,466 | 34.3% 1,321 | 1.8% 69 |
| 2000 | 64.3% 2,430 | 28.9% 1,093 | 6.8% 256 |
| 1996 | 50.9% 1,678 | 36.2% 1,191 | 12.9% 425 |
| 1992 | 46.5% 1,917 | 28.7% 1,186 | 24.8% 1,024 |
| 1988 | 59.6% 2,471 | 39.0% 1,616 | 1.5% 62 |
| 1984 | 66.0% 2,895 | 31.2% 1,367 | 2.9% 125 |
| 1980 | 65.7% 3,101 | 26.3% 1,239 | 8.0% 378 |
| 1976 | 54.0% 2,810 | 43.7% 2,274 | 2.4% 125 |
| 1972 | 63.8% 3,317 | 34.6% 1,801 | 1.6% 85 |
| 1968 | 56.0% 2,574 | 36.7% 1,686 | 7.3% 336 |
| 1964 | 38.0% 1,961 | 61.9% 3,198 | 0.2% 8 |
| 1960 | 57.6% 3,348 | 42.3% 2,460 | 0.0% 2 |
| 1956 | 61.8% 3,077 | 37.9% 1,887 | 0.3% 13 |
| 1952 | 67.5% 4,012 | 31.8% 1,891 | 0.7% 41 |
| 1948 | 46.7% 2,406 | 51.7% 2,666 | 1.6% 83 |
| 1944 | 45.0% 2,410 | 54.2% 2,903 | 0.9% 48 |
| 1940 | 43.9% 2,924 | 55.8% 3,711 | 0.3% 20 |
| 1936 | 31.5% 2,040 | 63.9% 4,139 | 4.7% 302 |
| 1932 | 34.2% 1,911 | 65.0% 3,636 | 0.8% 43 |
| 1928 | 60.8% 3,324 | 39.1% 2,141 | 0.1% 7 |
| 1924 | 59.0% 2,783 | 12.5% 588 | 28.5% 1,344 |
| 1920 | 73.2% 3,925 | 26.2% 1,405 | 0.5% 29 |
| 1916 | 50.7% 1,469 | 48.3% 1,400 | 1.0% 28 |
| 1912 | 24.8% 615 | 39.2% 975 | 36.0% 895 |
| 1908 | 52.6% 1,389 | 44.8% 1,185 | 2.6% 69 |
| 1904 | 70.0% 1,870 | 27.8% 743 | 2.2% 58 |
| 1900 | 55.3% 1,732 | 42.2% 1,321 | 2.5% 77 |
References
- "State & County QuickFacts". US Census Bureau. Archived from the original on June 7, 2011. Retrieved November 1, 2013.
- "Find a County". National Association of Counties. Retrieved June 7, 2011.
- About US: "Move to the Plains" Archived March 10, 2011, at the Wayback Machine, Turtle Mountain Band of Chippewa Indians, accessed June 27, 2011
- Ojibwe People's Dictionary, University of Minnesota
- Wick, Douglas A. (1988). North Dakota Place Names. Bismarck ND: Hedemarken Collectibles. ISBN 0-9620968-0-6. OCLC 191277027.
- "County History". North Dakota.gov. The State of North Dakota. Archived from the original on February 2, 2015. Retrieved February 4, 2015.
- Long, John H. (2006). "Dakota Territory, South Dakota, and North Dakota: Individual County Chronologies". Dakota Territory Atlas of Historical County Boundaries. The Newberry Library. Archived from the original on November 11, 2007. Retrieved February 26, 2019.
- Johnson, Sveinbjorn (1906). Libby, Orin Grant (ed.). The Icelandic Settlement of Pembina County. Collections of the State Historical Society of North Dakota. 1. Bismarck ND: Tribune, State Printers and Binders. pp. 89–130. OCLC 01773487.
- Williams, Mary Ann (Barnes) (1966). Origins of North Dakota Place Names. Bismarck ND: Bismarck Tribune, 1966. OCLC 431626.
- North Dakota Secretary of State (1989). North Dakota Centennial Blue Book. Bismarck ND: North Dakota Legislative Assembly. p. 539.
- Pembina County ND Google Maps (accessed 26 February 2019)
- ""Find an Altitude/Pembina County ND" Google Maps (accessed 26 February 2019)". Archived from the original on May 21, 2019. Retrieved February 27, 2019.
- "2010 Census Gazetteer Files". US Census Bureau. August 22, 2012. Archived from the original on January 29, 2015. Retrieved February 1, 2015.
- "Population and Housing Unit Estimates". Retrieved April 2, 2020.
- "US Decennial Census". US Census Bureau. Retrieved February 1, 2015.
- "Historical Census Browser". University of Virginia Library. Retrieved February 1, 2015.
- Forstall, Richard L., ed. (April 20, 1995). "Population of Counties by Decennial Census: 1900 to 1990". US Census Bureau. Retrieved February 1, 2015.
- "Census 2000 PHC-T-4. Ranking Tables for Counties: 1990 and 2000" (PDF). US Census Bureau. April 2, 2001. Retrieved February 1, 2015.
- U.S. Census Bureau. Census 2000. "Census Demographic Profiles, Pembina County" (PDF). CenStats Databases. Retrieved January 31, 2009.
- U.S. Census Bureau. Census 2000, Summary File 1. "GCT-PH1. Population, Housing Units, Area, and Density: 2000 - County -- Subdivision and Place". American FactFinder. <http://factfinder2.census.gov>. Retrieved January 31, 2008.
- U.S. Census Bureau. Census 2000. "QT-P1. Age Groups and Sex, Pembina County". American FactFinder. <http://factfinder.census.gov>. Retrieved January 31, 2009.
- "Profile of General Population and Housing Characteristics: 2010 Demographic Profile Data". US Census Bureau. Archived from the original on February 13, 2020. Retrieved April 3, 2016.
- "Population, Housing Units, Area, and Density: 2010 - County". US Census Bureau. Archived from the original on February 13, 2020. Retrieved April 3, 2016.
- "Selected Social Characteristics in the US – 2006-2010 American Community Survey 5-Year Estimates". US Census Bureau. Archived from the original on February 13, 2020. Retrieved April 3, 2016.
- "Selected Economic Characteristics – 2006-2010 American Community Survey 5-Year Estimates". US Census Bureau. Archived from the original on February 13, 2020. Retrieved April 3, 2016.
- Leip, David. "Atlas of US Presidential Elections". uselectionatlas.org. Retrieved April 13, 2018.
External links
- Pembina County official website
- Icelandic State Park
- Pembina County, North Dakota in the World War (1919) from the Digital Horizons website
- Homestead maps of Pembina County from the Digital Horizons website
- Pembina's pride-? : our rambling court house : new county buildings--where? (1910) from the Digital Horizons website
- Pembina County maps, Sheet 1 (northern) and Sheet 2 (southern), North Dakota DOT
Places adjacent to Pembina County, North Dakota | |
|---|---|
Municipalities and communities of Pembina County, North Dakota, United States | ||
|---|---|---|
| Cities | Map of North Dakota highlighting Pembina County | |
| Townships | ||
| Unincorporated communities | ||

| Authority control |
|
|---|