Majority minority
A majority-minority or minority-majority area is a term used to refer to a subdivision in which one or more racial and/or ethnic minorities (relative to the whole country's population) make up a majority of the local population.
United States
In the United States of America, majority-minority area or minority-majority area is a term describing a U.S. state or jurisdiction whose population is composed of less than 50% non-Hispanic whites. Racial data is derived from self-identification questions on the U.S. Census and on U.S. Census Bureau estimates. (See Race and ethnicity in the United States Census). The term is often used in voting rights law to designate voting districts which are altered under the Voting Rights Act to enable ethnic or language minorities "the opportunity to elect their candidate of choice."[1] In that context, the term is first used by the Supreme Court in 1977.[2] The Court had previously used the term in employment discrimination and labor relations cases.[3]
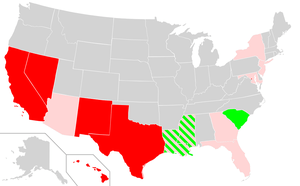
- Five states are majority-minority as of 2016: Hawaii (which is the only state that has never had a white majority), New Mexico, California, Texas and Nevada.[4][5]
- The District of Columbia reached a majority Black status during the latter stages of the Great Migration. Although the district is still majority-minority, Blacks made up only 46.4% of the population in 2019.[6] Increases have been among minorities who identify as Asians and Hispanics. Whites have also moved into the district in increasing numbers since the turn of the 21st century.[7]
- The percentage of non-Hispanic white residents has fallen below 60% in Maryland (50.5% in 2019),[8] Georgia (52.4% in 2019),[9] Florida (53.5% in 2019),[10] Arizona (54.4% as 2019), New Jersey, New York, Mississippi, and Louisiana. Maryland, at 50.5% non-Hispanic White as of 2019, is on the verge of becoming majority minority.
- All populated United States territories (Puerto Rico, Guam, the U.S. Virgin Islands, the Northern Mariana Islands, and American Samoa) are majority-minority areas. They never had a non-Hispanic white majority.
- As of 2012, 50 metropolitan areas in the U.S. are majority-minority.[11]
- As of 2015, 12% of U.S. counties are majority-minority.[12]
- The whole United States of America is projected to become majority-minority by the middle of the 21st century if current trends continue, making the US the first major post-industrial society in the world where the majority status of a dominant group will be lost due to mass immigration.[13] With alternate immigration scenarios, the whole United States is projected to become majority-minority sometime between 2041 and 2046 (depending on the amount of net immigration into the U.S. over the preceding years).[14][15]
- Ethnic minority children will be the majority in the entire United States by 2020.[16]
- Minority children are the majority among children in the following ten states: California, Nevada, New Mexico, Arizona, Texas, Florida, Georgia, Hawaii, Mississippi, and Maryland.[17]
States
From colonial times to the early-twentieth century, much of the Lower South had a Black majority. Three Southern states had populations that were majority Black: Louisiana (from 1810 until about 1890[18]), South Carolina (until the 1920s[19]) and Mississippi (from the 1830s to the 1930s[20]). In the same period, Georgia,[21] Alabama,[22] and Florida[23] had populations that were nearly 50% Black, while Maryland,[24] North Carolina,[25] and Virginia[26] had Black populations approaching or exceeding 40%. Texas' Black population reached 30%.[27]
The demographics of these states changed markedly from the 1890s through the 1950s, as two waves of the Great Migration led more than 6,500,000 African-Americans to abandon the economically depressed, segregated Deep South in search of better employment opportunities and living conditions, first in Northern and Midwestern industrial cities, and later west to California. One-fifth of Florida's Black population had left the state by 1940, for instance.[28] During the last thirty years of the twentieth century into the twenty-first century, scholars have documented a reverse New Great Migration of Blacks back to southern states, but typically to destinations in the New South, which have the best jobs and developing economies.[29]
The District of Columbia, one of the magnets for Great Migration Blacks, was long the sole majority-minority federal jurisdiction in the continental U.S. The Black proportion has declined since the 1990s due to gentrification and expanding opportunities, with many Blacks moving to Texas, Georgia, Florida, and Maryland and others migrating to jobs in states of the New South in a reverse of the Great Migration.[29] In 2018, the Black population represented only 44.4% of the D.C. population[30] — a considerable decline from 75% in the late-1970s. At the same time, Asian and Hispanic populations have increased in the District, keeping it a majority-minority area.
Since 1965, foreign immigration has spurred increases in the number of majority-minority areas, most notably in California.[31] Its legal resident population was 89.5% 'non-Hispanic white' in the 1940s, but in 2019 was estimated at 36.8% 'non-Hispanic white'.[32]
Cities
Many cities in the United States became majority-minority by 2010.[33] Out of the top 15 cities by population, Jacksonville, Florida and Fort Worth, Texas are the only ones not classified as majority-minority.
Data collection
The first data for New Mexico was a 5% sample in 1940 which estimated non-Hispanic whites at 50.9%.[34] Hispanics do not constitute a race but an ethnic and cultural group: of respondents who listed Hispanic origin, some listed White race, roughly half gave responses tabulated under "Some other race" (e.g. giving a national origin such as "Mexican" or a designation such as "Mestizo" as race), and much smaller numbers listed Black, Native American, or Asian race.
In U.S. censuses since 1990, self-identification has been the primary way to identify race. Presumption of race based on countries or regions given in the ancestry question is used only when a respondent has answered the ancestry question but not the race question. The U.S. Census currently defines "White people" very broadly as "people having origins in any of the original peoples of Europe, the Middle East, or North Africa,[35] i.e. Caucasoids. This definition has changed through the years.
Although the census attempts to enumerate both citizens and non-citizens, the undocumented immigrant population of the United States has proven hard to quantify; the census uses a 12 million base estimate nationally. However, current estimates based on national surveys, administrative data and other sources of information indicate that the current population may range as high as 20–30 million.[36]
Maps and graphs
| Area | White (all) | Non-Hispanic White | Asian American | African American | Hispanic or Latino American | Native American | Native Hawaiian | Two or more races |
|---|---|---|---|---|---|---|---|---|
| California | 57.6% | 40.1% | 13.0% | 6.2% | 37.6% | 1.0% | 0.4% | 4.9% |
| Hawaii | 24.7% | 22.7% | 38.6% | 1.6% | 8.9% | 0.3% | 10.0% | 23.6% |
| New Mexico | 68.4% | 40.5% | 1.4% | 2.1% | 46.3% | 9.4% | 0.1% | 3.7% |
| Texas | 70.4% | 45.3% | 3.8% | 11.8% | 37.6% | 0.7% | 0.1% | 2.7% |
| District of Columbia | 38.5% | 34.8% | 3.5% | 50.7% | 9.1% | 0.3% | 0.1% | 2.9% |
| United States | 72.4% | 63.7% | 4.8% | 12.6% | 16.3% | 0.9% | 0.2% | 2.9% |
SOURCE: U.S. Census Bureau, 2005 (for the year 2000)


Other uses
Normally, a state is considered to be majority-minority because of its ethnic/racial makeup, but other criteria are occasionally used, such as religion, disability, or age. For example, the majority of Utah residents are members of The Church of Jesus Christ of Latter-day Saints, a Christian denomination that is a religious minority throughout the rest of the United States. In addition to Utah, Rhode Island and Louisiana, which have Roman Catholic majorities, are the only states in the U.S. where a single denomination constitutes a majority of the population. However, no U.S. state has a majority composed of any non-Christian group, except for Hawaii, where 51.1% of the population follow religions that would be non-mainstream in the rest of the United States. Hawaii is classified as religious majority of Unaffiliated, including agnostics, atheists, humanists, the irreligious, and Secularists (non-practicing).
Criticism
In January 2016, CUNY sociologist Richard Alba wrote an article in the American Prospect arguing that the way in which majority-minority calculations are made by the Census are misleading. Anyone with any Hispanic, Asian, or Black ancestry is seen as non-white, even if they also have white ancestry. Alba argues that the incomes, marriage patterns, and identities of people of who are mixed Hispanic-white and Asian-white are closer to those of white people than monoracial Hispanics or Asians. Thus, when the Census says that non-Hispanic whites are projected to be less than 50% of the population by the 2040s, people of mixed-race ancestry are improperly excluded from that category.[37]
International applications
While the concept exists in other nations, the exact term differs from place to place and language to language.
In many large, contiguous countries like China, there are many autonomous regions where a minority population is the majority. These regions are generally the result of historical population distributions, not because of recent immigration or recent differences in birth and fertility rates between various groups.
English-speaking countries
Australia
It is estimated that Europeans first outnumbered Indigenous Australians in Australia in the 1840s.[38][39] There are still a number of rural and regional towns and communities where Indigenous Australians outnumber Europeans. Anglo-Celtic Australians, who as of 2019 make up 74% of Australia's population, have become a minority in some of Sydney's western suburbs in the late-twentieth century. Fairfield and Cabramatta in Fairfield City Council, Lakemba and Bankstown in the City of Canterbury-Bankstown, and Auburn in Cumberland Council, are one of the largest non-Anglo-Celtic suburbs in Australia.[40]
Non-Anglo-Celtic ethnic groups are the majority in these suburbs of Sydney's metropolitan area:
- Vietnamese people are the majority in the greater western suburbs of Cabramatta,[41] Canley Vale, Canley Heights, Carramar, Birrong, and also in the suburbs of Fairfield East, Fairfield West, St John's Park, Bonnyrigg, Wakeley and Green Valley, which also have a large Assyrian community.[40] Furthermore, people of Chinese ancestry are also significant in these suburbs.[40]
- Chinese people in the suburbs towards Inner West Sydney, such as, Haymarket (Chinatown), Canterbury Eastwood, Enfield, Campsie, Meadowbank, Rhodes, Newington, Homebush, Ashfield, Burwood, Strathfield and Berala, Regents Park and Auburn. These suburbs also have a significant amount of Lebanese people.[40]
- Lebanese people in Lakemba, Bass Hill, Yagoona, Condell Park, Sefton, Greenacre, Belfield, Bankstown, Merrylands, Punchbowl, Granville, Yagoona, Villawood and Guildford.[42][43][44][45]
- Indian people in the northwest suburbs of Sydney, such as, Parramatta, Harris Park, Girraween, Pendle Hill, Westmead, Wentworthville, Holroyd, Rosehill, and a few suburbs in South-western Sydney, such as Glenfield[40] and Ingleburn.[40]
- Assyrian people in the greater western suburbs of Fairfield, Fairfield Heights and Greenfield Park.[46]
- Filipino people in the northwestern suburbs of Rooty Hill,[40] Plumpton[40] and Mount Druitt.[47] Moreover, Indians are the second largest ethnicity in these suburbs[40]
Canada
- Unlike in the United States where there are five minority-majority states, none of the Canadian provinces are minority-majority. The definition of an ethnic minority differs between US and Canada, since, whereas in the US this term includes anyone who is either not White or who is Hispanic (Hispanic Whites are considered as minority), in Canada it is defined (by the Employment Equity Act, used by Statistics Canada) as "persons, other than Aboriginal peoples, who are non-Caucasian in race or non-white in colour." Thus, (a) Aboriginals are considered majority, (b) Hispanic whites are considered majority, but (c) non-white Arabs and West Asians are considered a minority, even if Caucasian in race. However, the numbers are not close, so this difference does not bear any practical significance except for the territory of Nunavut and Northwest Territories, which would be minority-majority if the US-style definition of racial minority were to be applied (24,875 of 29,325 residents in Nunavut are Inuit).
- The province with the highest proportion of visible minorities (2016 Census) is British Columbia (30.3%), followed by Ontario (29.3%). This means that in no Canadian province has the percentage of the racial majority (Aboriginals + White Caucasians) yet fallen under 65%.
- Toronto (CMA) is a minority-majority metropolitan area. Also, Vancouver (CMA) is on the tip of becoming such; in particular, according to the 2016 Census, the Toronto CMA has 51.4% of visible minorities, while the Vancouver CMA has 48.9% of visible minorities. These are the only metropolitan areas in Canada where the percentage of the racial majority has fallen under 60%. Taking into account the 20 largest census metropolitan areas, Calgary comes a distant third with 33.7%.
- Racial or "visible minorities" (as they are known in Canada) are the majority in the cities of Vancouver, and Toronto.
- The Toronto district of Scarborough has a population made up of 67.4% visible minorities; all but one of the ten Scarborough wards are visible-minority-majority, of which, in particular, Scarborough-Agincourt and Scarborough-Rouge River are Chinese-majority (53.4% and 57.3% respectively; 83.7% and 87.8% respectively for all visible minorities). Likewise, 19 of 25 Scarborough neighbourhoods (as designated by the City of Toronto) are visible-minority-majority. For purposes of contradistinction, in the "Old" (pre-amalgamation) City of Toronto, 68% of the population are white Caucasian (or Aboriginal) and the visible-minority-majority neighbourhoods are five in a total of 44 neighbourhoods (Regent Park, North St. James Town, Bay Street Corridor, Kensington-Chinatown, and Parkdale).
- The Toronto suburbs of Markham (77.93%) and Brampton (73.31%) also have a minority-majority population, of primarily Chinese and East Indian ethnic origin respectively.
- The Vancouver suburbs of Richmond (76.3%) and Burnaby (63.6%) also have a minority-majority population, of primarily Chinese ethnic origin in both cases.
- The French linguistic minority is the majority in the province of Quebec (77.1% have French as their mother tongue, according to the 2016 Census), and has been the predominant language of the province since before Canadian Confederation.
- Regarding religion (2001 Census data), Quebec and New Brunswick have a Roman Catholic majority, while Newfoundland and Labrador and Nunavut have a Protestant majority. In the other provinces and territories, no denomination exceeds the 50% mark; however, Protestants are the largest denomination first in all provinces and territories except only Prince Edward Island and Northwest Territories where Catholics are the largest denomination. No other Christian denomination, other religion, or lack of religious affiliation as first or second in any province or territory.
Visible minority majorities in different Canadian municipalities:
British Columbia
- Richmond (76.3%) 2016
- Burnaby (63.6) 2016
- Surrey (52.6) 2016
- Vancouver (51.6) 2016
- Coquitlam (50.2) 2016
Ontario
- Markham (77.93) 2016
- Brampton (73.31) 2016
- Richmond Hill (59.96) 2016
- Mississauga (57.15) 2016
- Ajax (56.67) 2016
- Toronto (51.5%) 2016
England
- White British (mainly English people) are an ethnic minority in London (43.7%), although those identifying as "White" comprise 59.8% of London's population.[48]
- White British people are also a minority in Luton, Slough and Leicester.
- Predominantly Muslim South Asians make up just under 30% of the population of the city of Blackburn, but make over 50% of those under 18.[49]
New Zealand
- European New Zealanders are a minority in six of Auckland's local board areas (Whau, Puketapapa, Maungakiekie–Tamaki, Mangere–Otahuhu, Otara–Papatoetoe, and Manurewa) and the Wairoa District.[50]
- The indigenous Māori people form a majority in the Kawerau, Opotiki and Wairoa Districts, and the Chatham Islands Territory.[50]
- Pacific peoples form a majority in the Mangere–Otahuhu local board area of Auckland.[50]
South Africa
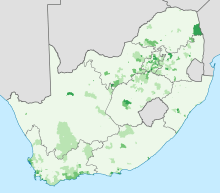
- Whites and Coloureds are a majority in some parts of South Africa while being a minority in South Africa overall.
Brazil
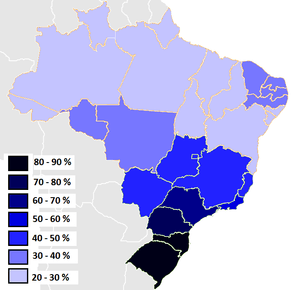
Brazil has become a majority "non-White" country as of the 2010 census,[51] together with the federative units of Espírito Santo, the Federal District, Goiás, and Minas Gerais.
Those identifying as White declined to 47.7% (about 91 million people) in the 2010 census from 52.9% (about 93 million people) in 2000 in the entire country.[51] However, in Brazil, this is not simply a matter of origin and birthrate, but identity changes as well. The Black minority did not enlarge its representation in the population to more than 1.5% in the period, while it was mostly the growth in the number of pardo people (~38% in 2000, 42.4% in 2010) that caused the demographic plurality of Brazil.
Bulgaria
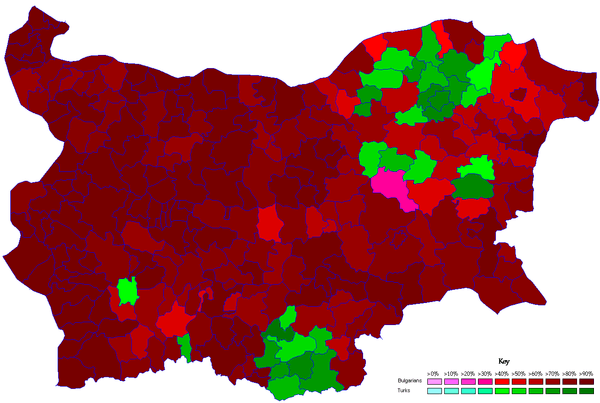
- Ethnic Turks outnumber ethnic Bulgarians in Kardzhali and Razgrad Provinces (ethnic Bulgarians are an about 85% majority in Bulgaria overall).[52]
- According to the Bulgarian census of 2001, a total of 43 municipalities (out of 262) have a Muslim majority, although Muslims only form around 10% of Bulgaria's total population.[53]
Colombia
Afro-Colombians make up roughly about 10–12% of country's overall population, but make up a majority in many areas in the Colombia's Pacific region,[54] especially in Chocó Department, where they make up 80–90% of the population.[55]
East Timor
Fiji
- Fiji did not have any racial or ethnic group comprise a majority from the 1930s to the 1990s, with the exception of the 1960s and possibly early-1970s.[57]
India

- Muslims are a majority in the Lakshadweep and Jammu and Kashmir states/territories of India, and in some other districts of India. However, Muslims are a minority in India overall.
- Christians currently make up the majority of the Northeast Indian states of Nagaland at 90%, Mizoram at 88% and Meghalaya at 83.3%, although Christians do not even make up more than 3% of India's total population.[58]
- Sikhs make the majority of state of Punjab, although once again they do not form a majority in India overall.[59]
- In the Northeast Indian state of Arunachal Pradesh, no religious or ethnic group constitutes more than 30% of its population,[59] owing to the state's great cultural diversity.
Indonesia
- Indonesia is the world's most populous Muslim country, with Islam being practiced by around 88% of the population, or over 200 million people.[60] Despite this there are several areas of Indonesia where Muslims are the minority:
- 84% of the population of Bali practice a form of Hinduism called Balinese Hinduism,[61] although Hindus only form 1.7% of Indonesia's overall population.[60]
- Catholics for the majority of East Nusa Tenggara at 51%,[61] although Catholics only form about 3% of Indonesia's overall population.[60]
- Protestants form the majority in three Indonesian provinces: West Papua at 60%, Papua at 68%, and North Sulawesi at 64%.[61] Overall though Protestants only form about 7% of Indonesia's population.[60]
- Several neighborhoods and communities in major Indonesian cities such as Jakarta, Bandung, Semarang, Medan and Yogyakarta are pf predominantly of Chinese origin, although people of Chinese descent do not form more than 10% in any of these cities overall population and only form about 1-2% of Indonesia's overall population.[62]
Israel
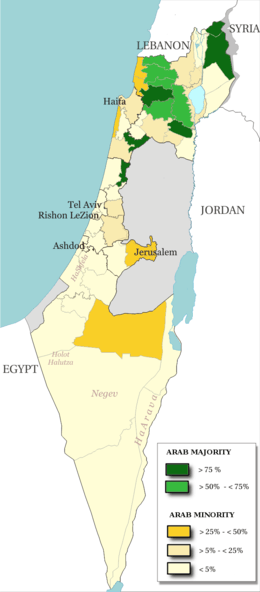
- Arabs are a majority of the population in Israel's Northern District and in several other smaller parts of Israel.[63]
- Non-Haredi Jews are projected to become a minority of Israel's total population by 2059.[64][65]
Italy
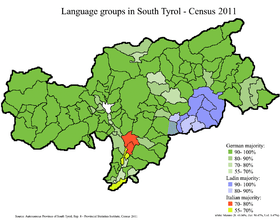
- German speakers are the local majority and an officially recognised national minority in the autonomous province of South Tyrol; standard German is taught in schools and used in all writing, but the South Tyrolean dialect is commonly spoken; German speakers are the majority in 103 out of 116 municipalities, and in the province as a whole.
- Ladin is a recognised minority language spoken in the Dolomites mountains, being the majority language in 15 municipalities of the Trentino-Alto Adige region.
- The Slovene minority in Italy is the majority in some municipalities in eastern parts of the Friuli-Venezia Giulia region.
- French and Franco-Provençal (Valdôtain) are officially recognised and spoken by 58% of the population of Aosta Valley region, although there is no official figure of the municipalities where speakers are majority.
Mongolia
- Kazakh-speaking Muslims make up around 93%[66] of Mongolia's Bayan-Ölgii Province, although they make up only about 3–5% of the overall population.[67]
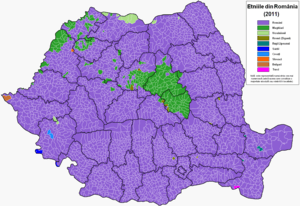
Romania
Slovakia
- Slovakia has some places/areas where Slovaks are a minority and Hungarians are a majority.[69]
Sri Lanka
- The Sinhalese are a minority in Northern Province, Eastern Province and most parts of the Colombo.[70]
Thailand
Former Soviet Union
Abkhazia (Georgia)
Azerbaijan
- Azeris are a minority in several parts/areas of Azerbaijan.[74]
Belarus
- Belarusians are a minority in some parts of Belarus.[75]
Estonia
Georgia
- The Georgian province of Samtskhe-Javakheti has an Armenian majority, while the Georgian province of Kvemo Kartli has an Azeri plurality.[78]
Kazakhstan
Kyrgyzstan
- The Kirgiz SSR did not have any ethnic group/nationality comprise a majority between 1941 and 1985.[79]
Latvia
- The Latvian SSR almost became minority-majority (the ethnic Latvian population there decreased from 62% to 52% between 1959 and 1989), but the collapse of the USSR prevented this from happening.[79][83][84][85] While the whole Latvian SSR never became majority-minority, its eight largest cities did become majority-minority by 1989.[86]
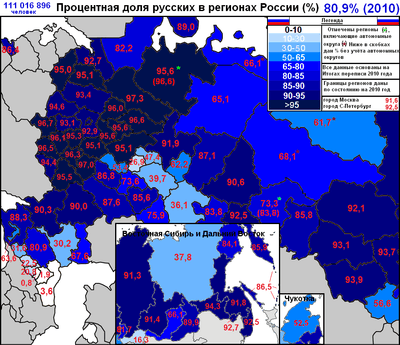
Russia
- Based on the 2010 census, 8 of the 22 republics of Russia had a non-Russian majority, while 9 of the 22 had a Russian majority.[87]
The Soviet Union as a whole
- There were concerns that the whole Soviet Union would lose its ethnic Russian majority due to the high birth rates in the Caucasus and Central Asia as early as 1970.[88] The percentage of Russians among the whole Soviet population was consistently declining, from 55% in 1959 to 51% in 1989.[79] However, the Soviet Union collapsed in 1991 occurred before the Soviet Union could have lost its ethnic Russian majority.
Transnistria (Moldova)
- Transnistria did not have any ethnic group compromise a majority of its population in 2004.[89]
Ukraine
- Ukrainians are a minority in the Crimea, Sevastopol, and some places in other regions, especially Donbass and Budjak.[90]
.png)
Former Yugoslavia
Bosnia and Herzegovina
- Bosnia and Herzegovina did not have any ethnic group comprise a majority of its population at the time of the last census in 1991 (which took place before the Bosnian War).[91] A census was conducted in Bosnia and Herzegovina in October 2013, and these results also showed that no majority population exists in the country, with the largest ethnic group being Bosniaks, who constitute 48.4% of the population (just short of a majority).
Kosovo
- North Kosovo has a Serb majority, while Kosovo overall has an Albanian majority.[92] This division has led to controversial negotiations for land swapping southern Albanian-majority areas of Serbia for northern Serb-majority areas of Kosovo.[93][94]
Montenegro
- Montenegro does not have any ethnic group compromise a majority of its population.[95]
North Macedonia
- North Macedonia has some places/areas where Macedonians are a minority.[96] These places/areas often have an Albanian majority.[96]
Serbia
- Serbia has some municipalities where Serbs are a minority, notably in north of Vojvodina where Hungarians are a majority.[97][98]
- Bosniak Muslims form the majority of the city of Novi Pazar and the surrounding region, although they only form around 3% of Serbia's total population.[99]
- Albanians form the majority of population in the municipalities of Preševo and Bujanovac.[100]
See also
- List of majority minority United States congressional districts
- Lists of U.S. cities with non-white majority populations
- List of U.S. communities with Hispanic-majority populations in the 2010 census
- Race and ethnicity in censuses
- Race and ethnicity in the United States
- Race and ethnicity in the United States Census
- Dominant minority
References
- United Jewish Organizations of Williamsburgh, Inc. v. Carey, 430 U.S. 144 97 S.Ct. 996 (Supreme Court of the United States March 01, 1977).
- United Jewish Organizations of Williamsburgh, Inc. v. Carey, 430 U.S. 144 97 S.Ct. 996 (Supreme Court of the United States March 01, 1977)
- Sledge (Harrison) v. J.P. Stevens & Co., Not Reported in F.Supp. 1975 WL 278 (United States District Court; E.D. North Carolina, Wilson Division. December 22, 1975); Winchester Spinning Corp. v. N. L. R. B., 402 F.2d 299 (United States Court of Appeals Fourth Circuit. October 08, 1968).
- "U.S. whites will soon be the minority in number, but not power – Baltimore Sun". The Baltimore Sun. Retrieved January 21, 2018.
- "Minority population surging in Texas". NBC News. Associated Press. August 18, 2005. Retrieved December 7, 2009.
- "B03002 HISPANIC OR LATINO ORIGIN BY RACE - District of Columbia - 2018 American Community Survey 1-Year Estimates". U.S. Census Bureau. July 1, 2018. Retrieved November 4, 2019.
- Dorell, Oren (March 25, 2011). "In D.C., blacks are no longer the majority - USATODAY.com". Usatoday30.usatoday.com. Retrieved March 18, 2013.
- "B03002 HISPANIC OR LATINO ORIGIN BY RACE - Maryland - 2018 American Community Survey 1-Year Estimates". U.S. Census Bureau. July 1, 2019. Retrieved November 4, 2019.
- "B03002 HISPANIC OR LATINO ORIGIN BY RACE - Georgia - 2018 American Community Survey 1-Year Estimates". U.S. Census Bureau. July 1, 2018. Retrieved November 4, 2019.
- "B03002 HISPANIC OR LATINO ORIGIN BY RACE - Florida - 2018 American Community Survey 1-Year Estimates". U.S. Census Bureau. July 1, 2018. Retrieved November 25, 2019.
- "Share of Population by Race/Ethnicity – Rankings – diversitydata.org – data for diverse and equitable metropolitan areas". www.diversitydata.org.
- Overberg, Janet Adamy and Paul. "Population of Nonwhites Grows".
- "Whites to be minority in America in 2043: Census". GlobalPost. December 12, 2012. Retrieved June 6, 2013.
- Yen, Hope. "Longer US white majority if immigration slows". Bigstory.ap.org. Retrieved June 6, 2013.
- "2012 National Population Projections: Summary Tables – People and Households – U.S. Census Bureau". Census.gov. February 20, 2013. Archived from the original on May 3, 2013. Retrieved June 6, 2013.
- "Children of color projected to be majority of U.S. youth this year". PBS News Hour.
- "White children in the minority in 10 states – This Just In – CNN.com Blogs". News.blogs.cnn.com. April 6, 2011. Retrieved March 18, 2013.
- "Table 33. Louisiana – Race and Hispanic Origin: 1810 to 1990" (PDF). Archived from the original (PDF) on March 27, 2010.
- "Race and Hispanic Origin for States" (PDF). Archived from the original (PDF) on February 7, 2014. Retrieved June 24, 2013.
- "Table 39. Mississippi – Race and Hispanic Origin: 1800 to 1990" (PDF). Archived from the original (PDF) on March 27, 2010.
- "Table 25. Georgia – Race and Hispanic Origin: 1790 to 1990" (PDF). Archived from the original (PDF) on October 23, 2013. Retrieved June 24, 2013.
- "Table 15. Alabama – Race and Hispanic Origin: 1800 to 1990" (PDF). Archived from the original (PDF) on October 23, 2013. Retrieved June 24, 2013.
- "Table 24. Florida – Race and Hispanic Origin: 1830 to 1990" (PDF). Archived from the original (PDF) on March 27, 2010.
- "Race and Hispanic Origin for States" (PDF). Archived from the original (PDF) on January 20, 2013. Retrieved June 24, 2013.
- "Race and Hispanic Origin for States" (PDF). Archived from the original (PDF) on January 20, 2013. Retrieved June 24, 2013.
- "Table 61. Virginia – Race and Hispanic Origin: 1790 to 1990" (PDF). Archived from the original (PDF) on March 27, 2010.
- "African Americans." Handbook of Texas. Retrieved on December 17, 2011.
- Maxine D. Rogers, et al., Documented History of the Incident Which Occurred at Rosewood, Florida in January 1923, December 1993, p.5 "Archived copy". Archived from the original on May 15, 2008. Retrieved May 1, 2008.CS1 maint: archived copy as title (link), March 28, 2008
- William H. Frey, "The New Great Migration: Black Americans' Return to the South, 1965–2000", The Brookings Institution, May 2004, pp.1–5 "Archived copy" (PDF). Archived from the original (PDF) on April 28, 2008. Retrieved May 19, 2008.CS1 maint: archived copy as title (link), accessed March 19, 2008
- "B03002 HISPANIC OR LATINO ORIGIN BY RACE - District of Columbia - 2018 American Community Survey 1-Year Estimates". U.S. Census Bureau. July 1, 2018. Retrieved November 4, 2019.
- "Table 19. California – Race and Hispanic Origin: 1850 to 1990" (PDF). Archived from the original (PDF) on January 21, 2015. Retrieved June 24, 2013.
- "California: Population estimates, July 1, 2019, (V2016)". United States Census Bureau QuickFacts.
- Gibson, Campbell; Jung, Kay (February 2005). Historical Census Statistics On Population Totals By Race, 1790 to 1990, and By Hispanic Origin, 1970 to 1990, For Large Cities And Other Urban Places In The United States (Report). U.S. Census Bureau. Retrieved June 19, 2020.
- "Table 46. New Mexico – Race and Hispanic Origin: 1850 to 1990" (PDF). Archived from the original (PDF) on January 20, 2013. Retrieved June 24, 2013.
- The White Population: 2000, Census 2000 Brief C2KBR/01-4, U.S. Census Bureau, August 2001.
- Brad Knickerbocker (May 16, 2006). "Illegal immigrants in the US: How many are there?". The Christian Science Monitor.
- "The Likely Persistence of a White Majority".
- Broome (1988), pp. 102–103.
- Gittins, Ross (December 26, 2015). "Maybe the colonialists were actually a minority". Sydney Morning Herald. Retrieved August 19, 2017.
- Australian Bureau of Statistics (October 31, 2012). "Rooty Hill (State Suburb)". 2011 Census QuickStats. Retrieved April 25, 2015.

- Australian Bureau of Statistics (October 31, 2012). "Cabramatta (State Suburb)". 2011 Census QuickStats. Retrieved April 29, 2013.
- "2011 Census QuickStats: Bankstown". www.censusdata.abs.gov.au.
- Australian Bureau of Statistics (October 31, 2012). "Auburn (State Suburb)". 2011 Census QuickStats. Retrieved April 28, 2013.
- "2011 Census QuickStats: Fairfield (NSW)". www.censusdata.abs.gov.au.
- "2011 Census QuickStats: Punchbowl (Canterbury – NSW)". www.censusdata.abs.gov.au.
- Gorgees, P. 2003, 'The Assyrian Community's Continued Needs in the Fairfield LGA', in Checking the Pulse of Fairfield―Conference Report, Fairfield Migrant Resource Centre, Cabramatta.
- Australian Bureau of Statistics (October 31, 2012). "Mount Druitt (State Suburb)". 2011 Census QuickStats. Retrieved April 25, 2015.
- "Ethnicity and National Identity in England and Wales – Office for National Statistics". www.ons.gov.uk.
- Perlez, Jane (April 2, 2007). "Old Church Becomes Mosque in Uneasy Britain". The New York Times. Archived from the original on May 1, 2009. Retrieved April 30, 2010.
- "2013 Census QuickStats about culture and identity – data tables". Statistics New Zealand. April 15, 2014. Archived from the original on May 24, 2014. Retrieved February 12, 2016.
- Barnes, Taylor (May 24, 2011). "For the first time, blacks outnumber whites in Brazil" (PDF). The Miami Herald.
- "Ethnic composition of Bulgaria 2001". Pop-stat.mashke.org. Retrieved March 18, 2013.
- "Archived copy". Archived from the original on December 25, 2009. Retrieved November 7, 2012.CS1 maint: archived copy as title (link)
- Fundación Hemera (2007). "Ethnic groups: Afro-Colombians". Ethnicities of Colombia (in Spanish). Archived from the original on 22 February 2008. Retrieved 29 December 2007.
- "La visibilización estadística de los grupos étnicos colombianos" (PDF) (in Spanish).
- International Religious Freedom Report 2007: Timor Leste. United States Bureau of Democracy, Human Rights and Labor (14 September 2007). This article incorporates text from this source, which is in the public domain.
- "Pacific Regional Statistics – Secretariat of the Pacific Community". www.spc.int.
- ORGI. "Census of India Website : Office of the Registrar General & Census Commissioner, India". www.censusindia.gov.in.
- "Population by religion community – 2011". The Registrar General & Census Commissioner, India. Archived from the original on September 23, 2015.
- "Penduduk Menurut Wilayah dan Agama yang Dianut" [Population by Region and Religion] (in Indonesian). Jakarta, Indonesia: Badan Pusat Statistik. May 15, 2010. Retrieved October 20, 2011.
Religion is belief in Almighty God that must be possessed by every human being. Religion can be divided into Muslim, Christian, Catholic, Hindu, Buddhist, Hu Khong Chu, and Other Religion.
Muslim 207176162 (87.18%), Christian 16528513 (6.96), Catholic 6907873 (2.91), Hindu 4012116 (1.69), Buddhist 1703254 (0.72), Confucianism 117091 (0.05), Other 299617 (0.13), Not Stated 139582 (0.06), Not Asked 757118 (0.32), Total 237641326 - "Population by Region and Religion in Indonesia". BPS. 2010.
- Johnston, Tim (March 3, 2005). "Chinese diaspora: Indonesia". BBC News. BBC.
- "Statistical Abstract of Israel 2012 – No. 63 Subject 2 – Table No. 8". .cbs.gov.il. Archived from the original on November 13, 2012. Retrieved March 18, 2013.
- "CBS predicts Arab-haredi majority in 2059 – Israel News, Ynetnews". Ynetnews.com. June 20, 1995. Retrieved March 16, 2013.
- Arlosoroff, Meirav. "The majority in Israel is steadily becoming a minority – Business – Israel News | Haaretz Daily Newspaper". Haaretz.com. Retrieved June 24, 2013.
- Introduction
- 2010 Population and Housing Census of Mongolia. Data recorded in Brian J. Grim et al. Yearbook of International Religious Demography 2014. BRILL, 2014. p. 152
- "Ethnic composition of Romania 2002". Pop-stat.mashke.org. Retrieved March 16, 2013.
- "Ethnic composition of Slovakia 2011". Pop-stat.mashke.org. Retrieved March 18, 2013.
- "Census of Population and Housing – 2012". www.statistics.gov.lk.
- William M. Carpenter; James R. Lilley; David G. Wiencek; Henry Stephen Albinski. Asian Security Handbook: An Assessment of Political-Security Issues in the Asia-Pacific Region. M.E. Sharpe. pp. 240–6. ISBN 1-56324-813-1.
- "Ethnic composition of Abkhazia 2003". Pop-stat.mashke.org. Retrieved March 18, 2013.
- "Ethnic composition of Abkhazia 2011". Pop-stat.mashke.org. Retrieved March 18, 2013.
- "Ethnic composition of Azerbaijan 2009". Pop-stat.mashke.org. April 7, 1971. Retrieved March 22, 2013.
- "Ethnic composition of Belarus 2009". Pop-stat.mashke.org. Retrieved March 22, 2013.
- "Ethnic composition of Estonia 2000". Pop-stat.mashke.org. Retrieved March 18, 2013.
- "Ethnic composition of Estonia 2011". Pop-stat.mashke.org. Retrieved March 18, 2013.
- "Ethnic composition of Georgia 2002". Pop-stat.mashke.org. Retrieved March 22, 2013.
- "Приложение Демоскопа Weekly". Demoscope.ru. December 26, 2011. Archived from the original on October 12, 2013. Retrieved December 3, 2012.
- "Ethnodemographic situation in Kazakhstan" (PDF). Archived from the original (PDF) on January 20, 2013.
- "Ethnic composition of Kazakhstan: 2009 census" (in Russian). pop-stat.mashke.org. 2009. Retrieved January 1, 2019.
- "Ethnic composition of Kazakhstan: 2018 estimation (based on 2009 census)". Pop-stat.mashke.org. 2018. Retrieved January 1, 2019.
- "Migration Information Source – Latvia Looks West, But Legacy of Soviets Remains". Migrationinformation.org. Retrieved December 3, 2012.
- "Pittsburgh Post-Gazette – Google News Archive Search". news.google.com.
- "Ethnic composition of Latvia 2000". Pop-stat.mashke.org. Retrieved December 3, 2012.
- Latvia in Transition – Juris Dreifelds – Google Books. Books.google.com. February 23, 1996. Retrieved December 3, 2012.
- "Ethnic composition of Russia: 2010 census". Pop-stat.mashke.org. 2010. Retrieved January 1, 2019.
- "Sarasota Herald-Tribune – Google News Archive Search". news.google.com.
- "Ethnic composition of Transnistria 2004". Pop-stat.mashke.org. Retrieved June 26, 2013.
- "Ethnic composition of Ukraine 2001". Pop-stat.mashke.org. Retrieved March 22, 2013.
- "Ethnic composition of Bosnia & Herzegovina 1991". Pop-stat.mashke.org. Retrieved June 26, 2013.
- "Ethnic composition of Kosovo 2011". Pop-stat.mashke.org. Retrieved March 18, 2013.
- Bytyci, Fatos (September 6, 2018). "Kosovo, Serbia consider a land swap, an idea that divides the Balkans". Reuters.
- Kupchan, Charles A. (September 13, 2018). "An Offensive Plan for the Balkans That the U.S. Should Get Behind". New York Times.
- "Statistical Office of Montenegro". Monstat. Retrieved June 26, 2013.
- "Ethnic composition of Macedonia 2002 (new division)". Pop-stat.mashke.org. Retrieved March 18, 2013.
- "Ethnic composition of Serbia 2011". Pop-stat.mashke.org. Retrieved March 16, 2013.
- "Population – Data by Municipalities and Cities" (PDF). 2011 Census of Population, Households, and Dwellings in the Republic of Serbia. 2013.
- Government of Serbia 2014, p. 194.
- "2011 Census of Population, Households and Dwellings in the Republic of Serbia" (PDF). stat.gov.rs. Statistical Office of the Republic of Serbia. Archived from the original (PDF) on July 14, 2014. Retrieved January 15, 2017.
External links
- "U.S. Census demographic estimates". Archived from the original on December 6, 2006. Retrieved September 12, 2006.CS1 maint: BOT: original-url status unknown (link)
- 10% of U.S. Counties Now 'Majority-Minority'