United States presidential election in Alabama, 1956
|
| ||||||||||||||||||||||||||
| ||||||||||||||||||||||||||
All 11 Alabama votes to the Electoral College | ||||||||||||||||||||||||||
|---|---|---|---|---|---|---|---|---|---|---|---|---|---|---|---|---|---|---|---|---|---|---|---|---|---|---|
| ||||||||||||||||||||||||||
 County Results
Stevenson—80-90%
Stevenson—70-80%
Stevenson—60-70%
Stevenson—50-60%
Stevenson—40-50%
Stevenson—<40%
Eisenhower—<40%
Eisenhower—40-50%
Eisenhower—50-60%
Eisenhower—60-70% | ||||||||||||||||||||||||||
| ||||||||||||||||||||||||||

| Elections in Alabama | ||||||||
|---|---|---|---|---|---|---|---|---|
 | ||||||||
|
||||||||
|
| ||||||||
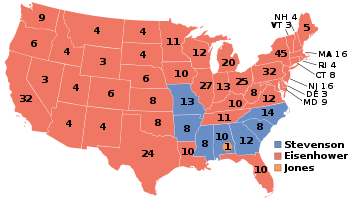
The 1956 United States presidential election in Alabama took place on November 6, 1956, as part of the 1956 United States presidential election. Alabama voters chose eleven[4] representatives, or electors, to the Electoral College, who voted for president and vice president.
Alabama was won by Adlai Stevenson (D–Illinois), running with Senator Estes Kefauver, with 56.52 percent of the popular vote against incumbent President Dwight D. Eisenhower (R–Pennsylvania), running with Vice President Richard Nixon, with 39.39 percent of the popular vote. Stevenson received ten of Alabama’s eleven electoral votes; the eleventh was cast by a faithless elector to Walter B. Jones.[5][6] As of the 2016 presidential election, this is the last election in which Macon County voted for a Republican nominee and the last time that Houston County voted for a Democratic presidential candidate.[7]
Results
| United States presidential election in Alabama, 1956 | ||||||
|---|---|---|---|---|---|---|
| Party | Candidate | Running mate | Votes | Percentage | Electoral votes | |
| Democratic | Adlai Stevenson | Estes Kefauver | 280,844 | 56.52% | 10 | |
| Democratic | Walter B. Jones | Herman E. Talmadge | 0 | 0.00% | 1 | |
| Republican | Dwight D. Eisenhower | Richard Nixon | 195,694 | 39.39% | 0 | |
| Dixiecrat | Unpledged electors T. Coleman Andrews |
Thomas Werdel | 20,323 | 4.09% | 0 | |
| Write-in | 10 | 0.00% | 0 | |||
| Totals | 496,871 | 100.00% | 11 | |||
Results by county
| County | Stevenson# | Stevenson% | Eisenhower# | Eisenhower% | Independent# | Independent% | Total votes cast[8] |
|---|---|---|---|---|---|---|---|
| Autauga | 1,161 | 50.77% | 857 | 37.47% | 269 | 11.76% | 2,287 |
| Baldwin | 3,878 | 46.08% | 4,293 | 51.02% | 244 | 2.90% | 8,415 |
| Barbour | 2,530 | 73.35% | 777 | 22.53% | 142 | 4.12% | 3,449 |
| Bibb | 1,471 | 56.97% | 1,004 | 38.88% | 107 | 4.14% | 2,582 |
| Blount | 3,208 | 54.17% | 2,628 | 44.38% | 86 | 1.45% | 5,922 |
| Bullock | 812 | 64.86% | 304 | 24.28% | 136 | 10.86% | 1,252 |
| Butler | 1,958 | 55.42% | 1,324 | 37.48% | 251 | 7.10% | 3,533 |
| Calhoun | 9,069 | 65.24% | 4,473 | 32.18% | 358 | 2.58% | 13,900 |
| Chambers | 5,165 | 76.67% | 1,448 | 21.49% | 124 | 1.84% | 6,737 |
| Cherokee | 2,661 | 75.75% | 845 | 24.05% | 7 | 0.20% | 3,513 |
| Chilton | 1,891 | 36.73% | 3,139 | 60.98% | 118 | 2.29% | 5,148 |
| Choctaw | 1,250 | 70.26% | 457 | 25.69% | 72 | 4.05% | 1,779 |
| Clarke | 1,962 | 57.91% | 1,246 | 36.78% | 180 | 5.31% | 3,388 |
| Clay | 1,677 | 50.47% | 1,597 | 48.06% | 49 | 1.47% | 3,323 |
| Cleburne | 1,407 | 56.96% | 1,056 | 42.75% | 7 | 0.28% | 2,470 |
| Coffee | 4,163 | 79.02% | 973 | 18.47% | 132 | 2.51% | 5,268 |
| Colbert | 7,007 | 78.40% | 1,819 | 20.35% | 111 | 1.24% | 8,937 |
| Conecuh | 1,687 | 61.26% | 885 | 32.14% | 182 | 6.61% | 2,754 |
| Coosa | 1,411 | 56.01% | 1,070 | 42.48% | 38 | 1.51% | 2,519 |
| Covington | 4,887 | 65.25% | 2,257 | 30.13% | 346 | 4.62% | 7,490 |
| Crenshaw | 2,252 | 75.70% | 567 | 19.06% | 156 | 5.24% | 2,975 |
| Cullman | 5,510 | 55.49% | 4,381 | 44.12% | 38 | 0.38% | 9,929 |
| Dale | 2,318 | 62.45% | 1,284 | 34.59% | 110 | 2.96% | 3,712 |
| Dallas | 2,121 | 39.59% | 2,324 | 43.37% | 913 | 17.04% | 5,358 |
| DeKalb | 5,768 | 50.30% | 5,684 | 49.56% | 16 | 0.14% | 11,468 |
| Elmore | 3,353 | 62.16% | 1,619 | 30.01% | 422 | 7.82% | 5,394 |
| Escambia | 3,437 | 64.86% | 1,529 | 28.85% | 333 | 6.28% | 5,299 |
| Etowah | 12,374 | 62.22% | 7,198 | 36.20% | 314 | 1.58% | 19,886 |
| Fayette | 1,956 | 49.80% | 1,948 | 49.59% | 24 | 0.61% | 3,928 |
| Franklin | 3,354 | 49.55% | 3,399 | 50.21% | 16 | 0.24% | 6,769 |
| Geneva | 2,841 | 68.99% | 1,179 | 28.63% | 98 | 2.38% | 4,118 |
| Greene | 691 | 66.19% | 309 | 29.60% | 44 | 4.21% | 1,044 |
| Hale | 1,314 | 68.54% | 504 | 26.29% | 99 | 5.16% | 1,917 |
| Henry | 2,127 | 78.40% | 429 | 15.81% | 157 | 5.79% | 2,713 |
| Houston | 3,630 | 53.06% | 2,632 | 38.47% | 579 | 8.46% | 6,841 |
| Jackson | 4,758 | 71.58% | 1,868 | 28.10% | 21 | 0.32% | 6,647 |
| Jefferson | 38,604 | 44.11% | 43,695 | 49.93% | 5,214 | 5.96% | 87,513 |
| Lamar | 2,501 | 73.58% | 867 | 25.51% | 31 | 0.91% | 3,399 |
| Lauderdale | 9,150 | 78.26% | 2,458 | 21.02% | 84 | 0.72% | 11,692 |
| Lawrence | 2,961 | 70.75% | 1,197 | 28.60% | 27 | 0.65% | 4,185 |
| Lee | 3,302 | 65.37% | 1,586 | 31.40% | 163 | 3.23% | 5,051 |
| Limestone | 4,145 | 87.26% | 589 | 12.40% | 16 | 0.34% | 4,750 |
| Lowndes | 623 | 52.27% | 326 | 27.35% | 243 | 20.39% | 1,192 |
| Macon | 1,024 | 46.69% | 1,067 | 48.65% | 102 | 4.65% | 2,193 |
| Madison | 9,054 | 74.52% | 2,993 | 24.63% | 103 | 0.85% | 12,150 |
| Marengo | 1,858 | 60.88% | 1,009 | 33.06% | 185 | 6.06% | 3,052 |
| Marion | 2,849 | 52.67% | 2,536 | 46.88% | 24 | 0.44% | 5,409 |
| Marshall | 6,329 | 66.66% | 3,071 | 32.34% | 95 | 1.00% | 9,495 |
| Mobile | 17,163 | 43.41% | 20,639 | 52.21% | 1,732 | 4.38% | 39,534 |
| Monroe | 2,069 | 69.95% | 759 | 25.66% | 130 | 4.39% | 2,958 |
| Montgomery | 6,890 | 36.57% | 8,727 | 46.32% | 3,224 | 17.11% | 18,841 |
| Morgan | 7,671 | 70.56% | 2,974 | 27.35% | 227 | 2.09% | 10,872 |
| Perry | 974 | 53.75% | 613 | 33.83% | 225 | 12.42% | 1,812 |
| Pickens | 1,660 | 58.78% | 993 | 35.16% | 171 | 6.06% | 2,824 |
| Pike | 2,631 | 68.53% | 997 | 25.97% | 211 | 5.50% | 3,839 |
| Randolph | 3,151 | 66.18% | 1,584 | 33.27% | 26 | 0.55% | 4,761 |
| Russell | 3,060 | 68.32% | 1,265 | 28.24% | 154 | 3.44% | 4,479 |
| St. Clair | 2,420 | 48.64% | 2,441 | 49.07% | 114 | 2.29% | 4,975 |
| Shelby | 2,502 | 44.83% | 2,901 | 51.98% | 178 | 3.19% | 5,581 |
| Sumter | 981 | 58.71% | 578 | 34.59% | 112 | 6.70% | 1,671 |
| Talladega | 5,243 | 54.63% | 4,197 | 43.73% | 157 | 1.64% | 9,597 |
| Tallapoosa | 5,070 | 72.00% | 1,879 | 26.68% | 93 | 1.32% | 7,042 |
| Tuscaloosa | 8,186 | 59.33% | 4,994 | 36.19% | 618 | 4.48% | 13,798 |
| Walker | 7,661 | 59.30% | 5,179 | 40.09% | 79 | 0.61% | 12,919 |
| Washington | 1,705 | 66.37% | 777 | 30.25% | 87 | 3.39% | 2,569 |
| Wilcox | 778 | 52.78% | 499 | 33.85% | 197 | 13.36% | 1,474 |
| Winston | 1,570 | 34.35% | 2,998 | 65.60% | 2 | 0.04% | 4,570 |
| Totals | 280,844 | 56.52% | 195,694 | 39.39% | 20,323 | 4.09% | 496,861 |
References
- ↑ "United States Presidential election of 1956 - Encyclopædia Britannica". Retrieved June 10, 2017.
- ↑ "The Presidents". David Leip. Retrieved September 27, 2017.
Eisenhower's home state for the 1956 Election was Pennsylvania
- ↑ Although he was born in Texas and grew up in Kansas before his military career, at the time of the 1952 election Eisenhower was president of Columbia University and was, officially, a resident of New York. During his first term as president, he moved his private residence to Gettysburg, Pennsylvania, and officially changed his residency to Pennsylvania.
- ↑ "1956 Election for the Forty-Fourth Term (1961-65)". Retrieved June 10, 2017.
- ↑ "1956 Presidential General Election Results - Alabama". Retrieved June 10, 2017.
- ↑ "The American Presidency Project – Election of 1956". Retrieved June 10, 2017.
- ↑ Sullivan, Robert David; ‘How the Red and Blue Map Evolved Over the Past Century’; America Magazine in The National Catholic Review; June 29, 2016
- ↑ Scammon, Richard M. (compiler); America at the Polls: A Handbook of Presidential Election Statistics 1920-1964; pp. 33-34 ISBN 0405077114
| Candidates |
|  |
|---|---|---|
| General articles |
| |
| Local results |
| |
| Other 1956 elections | ||