Norfolk County, Massachusetts
| Norfolk County, Massachusetts | |||
|---|---|---|---|
| County of Massachusetts | |||
| County of Norfolk | |||
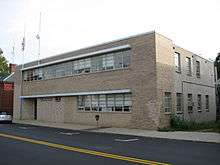
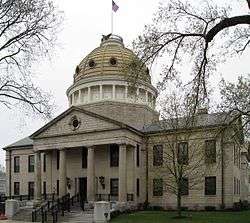 Norfolk County Courthouse in Dedham | |||
| |||
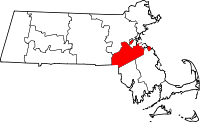 Location in the U.S. state of Massachusetts | |||
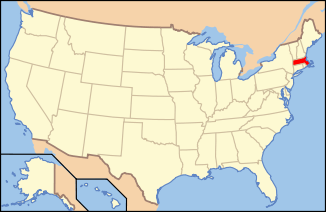 Massachusetts's location in the U.S. | |||
| Founded | 1793 | ||
| Named for | Norfolk | ||
| Seat | Dedham | ||
| Largest city | Quincy | ||
| Area | |||
| • Total | 444 sq mi (1,150 km2) | ||
| • Land | 396 sq mi (1,026 km2) | ||
| • Water | 48 sq mi (124 km2), 11% | ||
| Population | |||
| • (2010) | 670,850 | ||
| • Density | 1,694/sq mi (654/km2) | ||
| Congressional districts | 2nd, 4th, 7th, 8th | ||
| Time zone | Eastern: UTC−5/−4 | ||
| Website |
www | ||

Norfolk County is a county located in the U.S. state of Massachusetts. At the 2010 census, the population was 670,850.[1] Its county seat is Dedham.[2] The county was named after the English county of the same name.[3] Two towns, Cohasset and Brookline, are exclaves.
Norfolk County is included in the Boston-Cambridge-Newton, MA-NH Metropolitan Statistical Area.
Norfolk County is the 28th highest-income county in the United States with a median household income of $81,899. It is the wealthiest county in Massachusetts.
History
Norfolk County, Massachusetts was created on March 26, 1793 by legislation signed by Gov. John Hancock. Most of the towns were originally part of Suffolk County, Massachusetts. The towns of Dorchester and Roxbury were part of Norfolk County when it was created but, as Boston annexed each town, they became part of Suffolk County again. Hingham and Hull were originally part of the Norfolk County legislation but petitioned to remain in Suffolk county and in June 1793 their removal to Norfolk county was repealed. Later, in 1803, they were moved into Plymouth County, Massachusetts. The county is the birthplace of four Presidents of the United States (John Adams, John Quincy Adams, John F. Kennedy, and George H.W. Bush), resulting in the moniker "County of Presidents."[4]
Sheriffs
There have been 21 sheriffs of Norfolk County.[5]
| Years | Sheriff[5] |
|---|---|
| 1999–Present | Michael G. Bellotti |
| 1996–1999 | John H. Flood |
| 1975–1996 | Clifford H. Marshall |
| 1961–1975 | Charles Hedges |
| 1958–1961 | Peter M. McCormack |
| 1939–1958 | Samuel Wragg |
| 1898–1939 | Samuel Capen |
| 1885–1898 | Augustus B. Endicott |
| 1878–1885 | Rufus Corbin Wood |
| 1857–1878 | John W. Thomas |
| 1853–1857 | Thomas Adams |
| 1852–1853 | John W. Thomas |
| 1848–1852 | Thomas Adams |
| 1843–1848 | Jerauld N. E. Mann |
| 1834–1843 | John Baker, II |
| 1812–1834 | Elijah Crane |
| 1811–1812 | William Brewer |
| 1810–1811 | Elijah Crane |
| 1798–1810 | Benjamin Clark Cutler |
| 1794–1798 | Atherton Thayer |
| 1793–1794 | Ebeneezer Thayer |
Geography
According to the U.S. Census Bureau, the county has a total area of 444 square miles (1,150 km2), of which 396 square miles (1,030 km2) is land and 48 square miles (120 km2) (11%) is water.[6] It is the third-smallest county in Massachusetts by total area. The county is not completely contiguous; the towns of Brookline and Cohasset are each part of Norfolk County but are separated from the majority of Norfolk County (and each other) by either water or other counties. At the county's formation, Hingham and Hull were to be part of it, but joined Plymouth County instead, leaving Cohasset as the initial exclave of Norfolk County and an enclave of Plymouth County. Brookline became the second exclave of Norfolk County in 1873 when the neighboring town of West Roxbury was annexed by Boston (thus leaving Norfolk County to join Suffolk County) and Brookline refused to be annexed by Boston after the Brookline-Boston annexation debate of 1873.
Adjacent counties
- Middlesex County (northwest)
- Suffolk County (north)
- Plymouth County (southeast)
- Bristol County (south)
- Providence County, Rhode Island (southwest)
- Worcester County (west)
National protected areas
Demographics
| Historical population | |||
|---|---|---|---|
| Census | Pop. | %± | |
| 1800 | 27,216 | — | |
| 1810 | 31,245 | 14.8% | |
| 1820 | 36,471 | 16.7% | |
| 1830 | 41,972 | 15.1% | |
| 1840 | 53,140 | 26.6% | |
| 1850 | 78,892 | 48.5% | |
| 1860 | 109,950 | 39.4% | |
| 1870 | 89,443 | −18.7% | |
| 1880 | 96,507 | 7.9% | |
| 1890 | 118,950 | 23.3% | |
| 1900 | 151,539 | 27.4% | |
| 1910 | 187,506 | 23.7% | |
| 1920 | 219,081 | 16.8% | |
| 1930 | 299,426 | 36.7% | |
| 1940 | 325,180 | 8.6% | |
| 1950 | 392,308 | 20.6% | |
| 1960 | 510,256 | 30.1% | |
| 1970 | 605,051 | 18.6% | |
| 1980 | 606,587 | 0.3% | |
| 1990 | 616,087 | 1.6% | |
| 2000 | 650,308 | 5.6% | |
| 2010 | 670,850 | 3.2% | |
| Est. 2016 | 697,181 | [7] | 3.9% |
| U.S. Decennial Census[8] 1790-1960[9] 1900-1990[10] 1990-2000[11] 2010-2013[1] | |||
2000 census
As of the census[12] of 2000, there were 650,308 people, 248,827 households, and 165,967 families residing in the county. The population density was 1,628 people per square mile (628/km²). There were 255,154 housing units at an average density of 639 per square mile (247/km²). The racial makeup of the county was 89.02% White or European American, 3.18% Black or African American, 0.13% Native American, 5.50% Asian, 0.02% Pacific Islander, 0.78% from other races, and 1.37% from two or more races. 1.84% of the population were Hispanic or Latino of any race. 28.6% were of Irish, 13.4% Italian, 7.7% English and 5.0% descendants of colonists ancestry according to Census 2000. 85.7% spoke English, 2.3% Chinese in any dialect, 2.0% Spanish, 1.0% Italian and 1.0% French as their first language.
There were 248,827 households out of which 31.20% had children under the age of 18 living with them, 54.20% were married couples living together, 9.50% had a female householder with no husband present, and 33.30% were non-families. 26.80% of all households were made up of individuals and 10.80% had someone living alone who was 65 years of age or older. The average household size was 2.54 and the average family size was 3.14.
In the county, the population was spread out with 23.40% under the age of 18, 7.00% from 18 to 24, 31.60% from 25 to 44, 23.50% from 45 to 64, and 14.40% who were 65 years of age or older. The median age was 38 years. For every 100 females, there were 91.40 males. For every 100 females age 18 and over, there were 87.60 males.
The median income for a household in the county was $63,432, and the median income for a family was $77,847 (these figures had risen to $77,294 and $95,243 respectively as of a 2007 estimate[13]). Males had a median income of $51,301 versus $37,108 for females. The per capita income for the county was $32,484. About 2.90% of families and 4.60% of the population were below the poverty line, including 4.40% of those under age 18 and 5.70% of those age 65 or over.
2010 census
As of the 2010 United States Census, there were 670,850 people, 257,914 households, and 168,903 families residing in the county.[14] The population density was 1,693.6 inhabitants per square mile (653.9/km2). There were 270,359 housing units at an average density of 682.5 per square mile (263.5/km2).[15] The racial makeup of the county was 82.3% white, 8.6% Asian, 5.7% black or African American, 0.2% American Indian, 1.3% from other races, and 1.9% from two or more races. Those of Hispanic or Latino origin made up 3.3% of the population.[14] The largest ancestry groups were:[16]
- 31.8% Irish
- 15.5% Italian
- 11.0% English
- 7.0% German
- 4.6% French
- 4.3% Chinese
- 4.1% Polish
- 3.2% Russian
- 3.1% American
- 2.8% Scottish
- 2.6% French Canadian
- 2.4% Scotch-Irish
- 2.0% West Indian
- 2.0% Sub-Saharan African
- 1.9% Portuguese
- 1.8% Swedish
- 1.6% Indian
- 1.4% Arab
- 1.4% Greek
- 1.2% Canadian
- 1.1% Vietnamese
- 1.1% Lithuanian
Of the 257,914 households, 32.2% had children under the age of 18 living with them, 52.0% were married couples living together, 10.1% had a female householder with no husband present, 34.5% were non-families, and 27.6% of all households were made up of individuals. The average household size was 2.53 and the average family size was 3.15. The median age was 40.7 years.[14]
The median income for a household in the county was $81,027 and the median income for a family was $101,870. Males had a median income of $68,070 versus $51,870 for females. The per capita income for the county was $42,371. About 4.1% of families and 6.2% of the population were below the poverty line, including 6.3% of those under age 18 and 6.9% of those age 65 or over.[17]
Demographic breakdown by town
Income
The ranking of unincorporated communities that are included on the list are reflective if the census designated locations and villages were included as cities or towns. Data is from the 2007-2011 American Community Survey 5-Year Estimates.[18][19][20]
| Rank | Town | Per capita income |
Median household income |
Median family income |
Population | Number of households | |
|---|---|---|---|---|---|---|---|
| Dover | CDP | $91,039 | $183,125 | $212,125 | 2,322 | 725 | |
| 1 | Dover | Town | $82,800 | $184,646 | $200,735 | 5,564 | 1,765 |
| 2 | Wellesley | Town | $65,394 | $145,208 | $175,156 | 27,818 | 8,553 |
| 3 | Brookline | Town | $63,964 | $97,250 | $142,180 | 58,371 | 24,891 |
| 4 | Needham | Town | $60,972 | $121,080 | $160,455 | 28,786 | 10,350 |
| 5 | Cohasset | Town | $59,891 | $117,831 | $147,222 | 7,483 | 2,706 |
| 6 | Westwood | Town | $59,422 | $120,078 | $151,976 | 14,508 | 5,172 |
| 7 | Medfield | Town | $56,905 | $128,446 | $139,247 | 12,004 | 4,011 |
| Chestnut Hill (02467) | ZCTA | $55,947 | $114,140 | $151,375 | 21,952 | 6,237 | |
| 8 | Sharon | Town | $53,687 | $121,265 | $142,463 | 17,538 | 6,268 |
| Medfield | CDP | $47,660 | $107,386 | $127,632 | 6,394 | 2,357 | |
| 9 | Wrentham | Town | $47,119 | $100,938 | $119,188 | 10,879 | 3,978 |
| Sharon | CDP | $46,079 | $102,521 | $124,405 | 5,532 | 2,007 | |
| 10 | Canton | Town | $45,991 | $90,951 | $111,770 | 21,408 | 8,460 |
| 11 | Milton | Town | $44,718 | $104,713 | $129,234 | 26,828 | 8,956 |
| 12 | Medway | Town | $44,472 | $106,058 | $119,864 | 12,670 | 4,433 |
| 13 | Walpole | Town | $43,983 | $90,763 | $109,035 | 23,862 | 8,626 |
| Norfolk County | County | $43,685 | $83,733 | $106,309 | 666,426 | 255,944 | |
| 14 | Norfolk | Town | $42,452 | $118,809 | $132,250 | 11,151 | 3,125 |
| 15 | Foxborough | Town | $42,236 | $92,370 | $108,209 | 16,734 | 6,470 |
| Walpole | CDP | $41,820 | $89,327 | $99,808 | 6,119 | 2,522 | |
| 16 | Dedham | Town | $41,143 | $83,364 | $105,586 | 24,521 | 9,528 |
| Millis-Clicquot | CDP | $39,884 | $82,798 | $103,750 | 4,370 | 1,831 | |
| 17 | Millis | Town | $39,344 | $90,360 | $99,976 | 7,852 | 3,043 |
| 18 | Franklin | City | $39,043 | $92,066 | $109,602 | 31,317 | 10,866 |
| 19 | Braintree | City | $37,317 | $83,710 | $97,262 | 35,409 | 13,267 |
| 20 | Plainville | Town | $36,802 | $81,371 | $102,780 | 8,176 | 3,232 |
| Foxborough | CDP | $36,239 | $61,771 | $91,991 | 5,206 | 2,388 | |
| 21 | Norwood | Town | $35,997 | $73,838 | $95,397 | 28,483 | 11,559 |
| 22 | Weymouth | City | $35,939 | $68,594 | $86,972 | 53,565 | 22,543 |
| Massachusetts | State | $35,051 | $65,981 | $83,371 | 6,512,227 | 2,522,409 | |
| Bellingham | CDP | $33,927 | $81,941 | $87,606 | 4,580 | 1,833 | |
| 23 | Bellingham | Town | $33,170 | $83,534 | $93,655 | 16,165 | 5,879 |
| 24 | Quincy | City | $32,911 | $60,947 | $77,231 | 91,484 | 39,965 |
| 25 | Stoughton | Town | $32,363 | $68,191 | $87,070 | 26,893 | 10,455 |
| 26 | Avon | Town | $31,304 | $72,880 | $89,214 | 4,341 | 1,609 |
| 27 | Holbrook | Town | $29,940 | $63,790 | $76,568 | 10,749 | 4,193 |
| 28 | Randolph | City | $29,210 | $64,465 | $77,661 | 31,867 | 12,041 |
| United States | Country | $27,915 | $52,762 | $64,293 | 306,603,772 | 114,761,359 | |
Religion
| Religious Affiliation in Norfolk County | ||||||||
|---|---|---|---|---|---|---|---|---|
| Year | 1980 | 1990 | 2000 | 2010 | ||||
| Religion | C* | A** | C | A | C | A | C | A |
| Anabaptist (Mennonite) | n/a | n/a | 1 | 88 | 1 | 45 | n/a | n/a |
| Ba'haism | 0 | n/a | 0 | n/a | 2 | 180 | 1 | 198 |
| Baptist | 29 | 7,063 | 29 | 7,936 | 32 | 4,992 | 46 | 5,558 |
| Brethren | 3 | 95 | 1 | 50 | 0 | n/a | 0 | n/a |
| Buddhism | n/a | n/a | n/a | n/a | 4 | n/a | 7 | 1,653 |
| Catholicism | 64 | 304,137 | 63 | 336,797 | 63 | 380,930 | 52 | 355,321 |
| Congregationalism/
United Church of Christ |
35 | 16,786 | 43 | 19,016 | 41 | 22,049 | 42 | 12,879 |
| Christian Science | n/a | n/a | 7 | 350 | n/a | n/a | 5 | n/a |
| Episcopalianism/
Anglicanism |
31 | 17,955 | 30 | 12,905 | 31 | 12,778 | 33 | 11,016 |
| Hinduism | n/a | n/a | n/a | n/a | 6 | n/a | 2 | 37 |
| Independent/
nondenominational |
n/a | n/a | 1 | 800 | n/a | n/a | 20 | 2,620 |
| Islam | n/a | n/a | n/a | n/a | 2 | 3,782 | 3 | 4,616 |
| Jainism | n/a | n/a | n/a | n/a | 1 | n/a | 1 | n/a |
| Judaism | 20 | 8,258 | 41 | 37,123 | 41 | 38,300 | 20 | 19,709 |
| Lutheranism | 13 | 4,629 | 10 | 2,843 | 8 | 2,593 | 8 | 2,227 |
| Latter-day Saints | 1 | 432 | 2 | 648 | 5 | 1,150 | 4 | 1,262 |
| Methodism/Holiness | 25 | 7,937 | 21 | 7,114 | 24 | 7,097 | 23 | 5,667 |
| Messianic Judaism | n/a | n/a | n/a | n/a | n/a | n/a | 1 | n/a |
| Orthodoxy | n/a | n/a | 3 | n/a | 7 | 7,543 | 9 | 3,539 |
| Pentecostalism | 5 | 945 | 5 | 1,382 | 12 | 2,540 | 17 | 2,485 |
| Presbyterianism | 4 | 1,380 | 7 | 1,424 | 7 | 1,558 | 9 | 1,196 |
| Seventh-day Adventism/
Jehovah's Witnesses |
1 | 52 | 7 | 2,900 | 5 | 367 | 8 | 537 |
| Sikhism | n/a | n/a | n/a | n/a | 2 | n/a | 1 | n/a |
| Quakerism | 1 | 192 | 1 | 190 | 2 | 106 | 2 | 224 |
| Unitarian-Universalism | 18 | 4,719 | 17 | 4,591 | 17 | 2,644 | 17 | 3,102 |
| Zoroastranianism | n/a | n/a | n/a | n/a | n/a | n/a | 0 | 16 |
*congregations
**adherents
Politics
| Voter registration and party enrollment as of October 13, 2010[21] | |||||
|---|---|---|---|---|---|
| Party | Number of voters | Percentage | |||
| Democratic | 159,956 | 35.28% | |||
| Republican | 53,556 | 11.81% | |||
| Unenrolled | 237,810 | 52.45% | |||
| Minor Parties | 2,054 | 0.45% | |||
| Total | 453,376 | 100% | |||
| Year | Republican | Democratic | Third parties |
|---|---|---|---|
| 2016 | 32.6% 119,723 | 60.3% 221,819 | 7.1% 26,153 |
| 2012 | 41.6% 148,393 | 56.9% 202,714 | 1.5% 5,416 |
| 2008 | 39.7% 136,841 | 58.2% 200,675 | 2.2% 7,400 |
| 2004 | 38.6% 127,763 | 60.2% 199,392 | 1.2% 3,982 |
| 2000 | 33.8% 107,033 | 59.4% 188,450 | 6.8% 21,694 |
| 1996 | 31.0% 92,982 | 60.1% 180,504 | 9.0% 26,985 |
| 1992 | 31.8% 103,255 | 46.4% 150,488 | 21.8% 70,521 |
| 1988 | 47.7% 150,306 | 50.9% 160,289 | 1.4% 4,461 |
| 1984 | 53.6% 160,313 | 46.2% 138,222 | 0.3% 784 |
| 1980 | 44.8% 136,184 | 38.6% 117,274 | 16.6% 50,271 |
| 1976 | 45.2% 136,628 | 51.3% 155,342 | 3.5% 10,646 |
| 1972 | 46.9% 134,459 | 52.6% 150,732 | 0.5% 1,558 |
| 1968 | 36.0% 95,858 | 60.3% 160,513 | 3.7% 9,835 |
| 1964 | 26.8% 68,612 | 72.8% 186,488 | 0.4% 912 |
| 1960 | 47.2% 121,744 | 52.6% 135,474 | 0.2% 503 |
| 1956 | 66.4% 152,747 | 33.3% 76,656 | 0.3% 593 |
| 1952 | 65.2% 140,409 | 34.5% 74,321 | 0.3% 631 |
| 1948 | 56.7% 100,280 | 40.9% 72,327 | 2.3% 4,130 |
| 1944 | 58.2% 97,490 | 41.6% 69,606 | 0.2% 383 |
| 1940 | 58.7% 97,525 | 40.8% 67,654 | 0.5% 838 |
| 1936 | 55.4% 82,545 | 38.8% 57,770 | 5.8% 8,575 |
| 1932 | 59.2% 75,232 | 38.6% 49,121 | 2.2% 2,793 |
| 1928 | 60.7% 73,530 | 38.9% 47,057 | 0.4% 489 |
| 1924 | 71.1% 57,948 | 18.5% 15,041 | 10.5% 8,516 |
| 1920 | 74.7% 51,826 | 22.7% 15,720 | 2.7% 1,839 |
| 1916 | 58.7% 19,284 | 38.7% 12,702 | 2.6% 858 |
| 1912 | 32.8% 9,650 | 31.4% 9,244 | 35.8% 10,537 |
| 1908 | 64.9% 18,225 | 27.3% 7,682 | 7.8% 2,187 |
| 1904 | 62.2% 16,104 | 32.3% 8,372 | 5.5% 1,434 |
| 1900 | 62.3% 15,144 | 32.6% 7,922 | 5.1% 1,232 |
| 1896 | 73.5% 16,897 | 21.7% 4,990 | 4.8% 1,113 |
| 1892 | 52.1% 11,862 | 45.4% 10,327 | 2.5% 575 |
| 1888 | 54.0% 10,770 | 43.7% 8,720 | 2.3% 449 |
| 1884 | 47.1% 8,351 | 41.3% 7,321 | 11.6% 2,051 |
| 1880 | 59.7% 10,019 | 38.7% 6,498 | 1.6% 265 |
| 1876 | 57.2% 8,956 | 42.7% 6,685 | 0.1% 22 |
Communities
Cities
Towns
Note: West Roxbury (annexed to Boston 1874), Roxbury (annexed to Boston 1868), Dorchester (founded 1630, annexed to Boston 1870), Hyde Park (incorporated 1868 from Dorchester, Milton, and Dedham, annexed to Boston 1912), and Hingham and Hull were originally part of Norfolk County when the county was incorporated in 1793. As of August 2012, Hingham's Precinct 2 will be part of the Fourth Norfolk District.[23]
Census-designated places
See also
References
- 1 2 "State & County QuickFacts". United States Census Bureau. Retrieved August 26, 2013.
- ↑ "Find a County". National Association of Counties. Retrieved June 7, 2011.
- ↑ Thomas Cox, Anthony Hall, Robert Morden, Magna Britannia Antiqua & Nova: Or, A New, Exact, and Comprehensive Survey of the Ancient and Present State of Great Britain, Volume 5, (Caesar Ward and Richard Chandler: London, 1738), pg. 171 (accessed on Google Book Search, June 22, 2008)
- ↑ The County of Norfolk, Massachusetts. Last accessed December 21, 2006.
- 1 2 "History". Norfolk County Sheriff's Office. Retrieved October 25, 2016.
- ↑ "2010 Census Gazetteer Files". United States Census Bureau. August 22, 2012. Archived from the original on September 14, 2014. Retrieved September 16, 2014.
- ↑ "Population and Housing Unit Estimates". Retrieved June 9, 2017.
- ↑ "U.S. Decennial Census". United States Census Bureau. Retrieved September 16, 2014.
- ↑ "Historical Census Browser". University of Virginia Library. Retrieved September 16, 2014.
- ↑ "Population of Counties by Decennial Census: 1900 to 1990". United States Census Bureau. Retrieved September 16, 2014.
- ↑ "Census 2000 PHC-T-4. Ranking Tables for Counties: 1990 and 2000" (PDF). United States Census Bureau. Retrieved September 16, 2014.
- ↑ "American FactFinder". United States Census Bureau. Retrieved January 31, 2008.
- ↑ Bureau, U.S. Census. "American FactFinder - Community Facts". factfinder.census.gov.
- 1 2 3 "DP-1 Profile of General Population and Housing Characteristics: 2010 Demographic Profile Data". United States Census Bureau. Retrieved January 12, 2016.
- ↑ "Population, Housing Units, Area, and Density: 2010 - County". United States Census Bureau. Retrieved January 12, 2016.
- ↑ "DP02 SELECTED SOCIAL CHARACTERISTICS IN THE UNITED STATES – 2006-2010 American Community Survey 5-Year Estimates". United States Census Bureau. Retrieved January 12, 2016.
- ↑ "DP03 SELECTED ECONOMIC CHARACTERISTICS – 2006-2010 American Community Survey 5-Year Estimates". United States Census Bureau. Retrieved January 12, 2016.
- ↑ "SELECTED ECONOMIC CHARACTERISTICS 2007-2011 American Community Survey 5-Year Estimates". U.S. Census Bureau. Retrieved January 26, 2013.
- ↑ "ACS DEMOGRAPHIC AND HOUSING ESTIMATES 2007-2011 American Community Survey 5-Year Estimates". U.S. Census Bureau. Retrieved January 26, 2013.
- ↑ "HOUSEHOLDS AND FAMILIES 2007-2011 American Community Survey 5-Year Estimates". U.S. Census Bureau. Retrieved January 26, 2013.
- ↑ "Registration and Party Enrollment Statistics as of October 15, 2008" (PDF). Massachusetts Elections Division of the Secretary of the Commonwealth of Massachusetts. Retrieved May 8, 2012.
- ↑ Leip, David. "Dave Leip's Atlas of U.S. Presidential Elections". uselectionatlas.org.
- ↑ Dever, Maryellen. "REDISTRICTING: Bradley loses precinct". wickedlocal.com.
- History of Norfolk County, Massachusetts With Biographical Sketches of Many of Its Pioneers and Prominent Men, by Duane Hamilton Hurd. Published by J.W. Lewis & Co., 1884. 1001 pages.
- History of Norfolk County, Massachusetts, 1622-1918 by Louis Atwood Cook. Published by The S.J. Clarke publishing company, 1918. Volume 1.
External links
| Wikimedia Commons has media related to Norfolk County, Massachusetts. |

- Norfolk County official site
- Map of cities and towns of Massachusetts
Places adjacent to Norfolk County, Massachusetts | ||||||||||
|---|---|---|---|---|---|---|---|---|---|---|
| ||||||||||
Municipalities and communities of Norfolk County, Massachusetts, United States | ||
|---|---|---|
| Cities | | |
| Towns | ||
| CDPs | ||
| Other villages | ||