Hampden County, Massachusetts
Coordinates: 42°08′N 72°38′W / 42.14°N 72.63°W
| Hampden County, Massachusetts | ||
|---|---|---|
| County of Massachusetts | ||
| County of Hampden | ||
 | ||
| ||
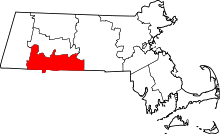 Location in the U.S. state of Massachusetts | ||
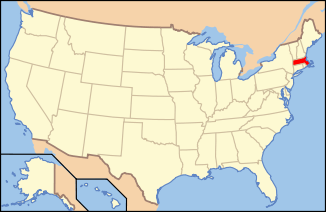 Massachusetts's location in the U.S. | ||
| Founded | 1812 | |
| Named for | John Hampden | |
| Seat | Springfield | |
| Largest city | Springfield | |
| Area | ||
| • Total | 634 sq mi (1,642 km2) | |
| • Land | 617 sq mi (1,598 km2) | |
| • Water | 17 sq mi (44 km2), 2.7% | |
| Population | ||
| • (2010) | 463,490 | |
| • Density | 751/sq mi (290/km2) | |
| Congressional districts | 1st, 2nd | |
| Time zone | Eastern: UTC−5/−4 | |

Hampden County is a non-governmental county located in the Pioneer Valley of the state of Massachusetts, in the United States. As of the 2010 census, Hampden County's population was 463,490.[1] Its traditional county seat is Springfield,[2] the Connecticut River Valley's largest city, and economic and cultural capital. Hampden County was split from Hampshire County in 1812, because Northampton, Massachusetts, was made Hampshire County's "shire town" in 1794; however, Springfield—theretofore Hampshire County's traditional shire town, dating back to its founding in 1636—grew at a pace far quicker than Northampton and was granted shire town-status over its own, southerly jurisdiction. It was named for John Hampden.[3] To the north of Hampden County is modern-day Hampshire County; to the west is Berkshire County; to the east is Worcester County; to the south are Litchfield County, Hartford County, and Tolland County in Connecticut.
Hampden County is part of the Springfield, MA Metropolitan Statistical Area. It is the most urban county in Western Massachusetts. The Knowledge Corridor surrounding Springfield-Hartford is New England's second most populous urban area (after Greater Boston) with 1.9 million people.
Law and government
Like an increasing number of Massachusetts counties, Hampden County exists today only as a historical geographic region, and has no county government. All former county functions were assumed by state agencies in 1998. The sheriff and some other regional officials with specific duties are still elected locally to perform duties within the county region, but there is no county council, county commission or other county governing body. Communities are now granted the right to form their own regional compacts for sharing services. Hampden County and Hampshire County together are part of the Pioneer Valley Planning Commission.
See also: MassGov page on counties.
| Voter Registration and Party Enrollment as of October 13, 2010[4] | |||||
|---|---|---|---|---|---|
| Party | Number of Voters | Percentage | |||
| Democratic | 116,645 | 39.66% | |||
| Republican | 38,458 | 13.08% | |||
| Unenrolled | 137,244 | 46.67% | |||
| Minor Parties | 2,177 | 0.60% | |||
| Total | 294,099 | 100% | |||
Politics
| Year | Republican | Democratic | Third parties |
|---|---|---|---|
| 2016 | 38.2% 78,685 | 54.6% 112,590 | 7.2% 14,826 |
| 2012 | 36.6% 73,392 | 61.7% 123,619 | 1.7% 3,388 |
| 2008 | 36.1% 71,350 | 61.4% 121,454 | 2.5% 4,916 |
| 2004 | 38.0% 70,925 | 60.9% 113,710 | 1.1% 2,004 |
| 2000 | 34.6% 59,558 | 58.2% 100,103 | 7.2% 12,432 |
| 1996 | 28.2% 48,513 | 61.0% 105,050 | 10.9% 18,676 |
| 1992 | 29.0% 54,621 | 45.7% 86,026 | 25.3% 47,618 |
| 1988 | 43.2% 74,872 | 56.1% 97,332 | 0.7% 1,216 |
| 1984 | 51.1% 89,330 | 48.6% 84,985 | 0.4% 656 |
| 1980 | 40.4% 72,528 | 44.7% 80,369 | 14.9% 26,823 |
| 1976 | 37.8% 70,008 | 59.4% 110,028 | 2.8% 5,254 |
| 1972 | 47.3% 86,164 | 52.1% 94,945 | 0.6% 1,024 |
| 1968 | 31.3% 55,783 | 62.5% 111,376 | 6.2% 10,991 |
| 1964 | 24.9% 44,299 | 74.7% 133,085 | 0.5% 835 |
| 1960 | 37.2% 72,054 | 62.5% 121,061 | 0.4% 713 |
| 1956 | 55.9% 104,689 | 43.6% 81,743 | 0.5% 935 |
| 1952 | 51.9% 98,641 | 47.8% 90,936 | 0.3% 616 |
| 1948 | 41.9% 70,256 | 56.4% 94,609 | 1.7% 2,855 |
| 1944 | 40.7% 63,293 | 59.1% 91,819 | 0.2% 374 |
| 1940 | 41.7% 64,502 | 57.8% 89,477 | 0.5% 817 |
| 1936 | 36.6% 51,288 | 57.2% 80,164 | 6.2% 8,728 |
| 1932 | 44.5% 55,032 | 51.1% 63,189 | 4.4% 5,408 |
| 1928 | 47.2% 56,063 | 52.2% 62,056 | 0.6% 703 |
| 1924 | 60.0% 46,489 | 24.6% 19,079 | 15.4% 11,947 |
| 1920 | 68.9% 46,741 | 28.3% 19,156 | 2.8% 1,923 |
| 1916 | 50.2% 18,207 | 46.9% 17,028 | 2.9% 1,042 |
| 1912 | 37.5% 11,393 | 34.9% 10,620 | 27.6% 8,410 |
| 1908 | 52.2% 14,485 | 35.7% 9,910 | 12.1% 3,358 |
| 1904 | 57.6% 14,962 | 36.1% 9,369 | 6.3% 1,641 |
| 1900 | 54.7% 13,757 | 41.4% 10,424 | 3.9% 989 |
| 1896 | 67.7% 16,064 | 28.6% 6,787 | 3.8% 893 |
| 1892 | 48.8% 11,373 | 48.2% 11,228 | 3.0% 693 |
| 1888 | 49.7% 9,577 | 47.6% 9,177 | 2.7% 511 |
| 1884 | 47.8% 7,897 | 43.8% 7,245 | 8.4% 1,394 |
| 1880 | 57.7% 8,673 | 41.2% 6,194 | 1.1% 170 |
| 1876 | 54.5% 7,963 | 45.2% 6,605 | 0.3% 46 |
Geography
According to the U.S. Census Bureau, the county has a total area of 634 square miles (1,640 km2), of which 617 square miles (1,600 km2) is land and 17 square miles (44 km2) (2.7%) is water.[6]
Adjacent counties
- Hampshire County (north)
- Worcester County (east)
- Tolland County, Connecticut (southeast)
- Hartford County, Connecticut (south)
- Litchfield County, Connecticut (southwest)
- Berkshire County (west)
Communities
Cities
- Agawam
- Chicopee
- Holyoke
- Palmer
- Springfield (traditional county seat)
- West Springfield
- Westfield
Towns
Census-designated places
Other unincorporated communities
- Aldenville
- Bondsville
- Burnett Road
- Depot Village
- Fairview
- Feeding Hills
- Three Rivers
- Woronoco
City neighborhoods
The following are neighborhoods located in Springfield or West Springfield.
National Parks
Demographics
| Historical population | |||
|---|---|---|---|
| Census | Pop. | %± | |
| 1820 | 28,021 | — | |
| 1830 | 31,639 | 12.9% | |
| 1840 | 37,366 | 18.1% | |
| 1850 | 51,283 | 37.2% | |
| 1860 | 57,366 | 11.9% | |
| 1870 | 78,409 | 36.7% | |
| 1880 | 104,142 | 32.8% | |
| 1890 | 135,713 | 30.3% | |
| 1900 | 175,603 | 29.4% | |
| 1910 | 231,369 | 31.8% | |
| 1920 | 300,305 | 29.8% | |
| 1930 | 335,496 | 11.7% | |
| 1940 | 332,107 | −1.0% | |
| 1950 | 367,971 | 10.8% | |
| 1960 | 429,353 | 16.7% | |
| 1970 | 459,050 | 6.9% | |
| 1980 | 443,018 | −3.5% | |
| 1990 | 456,310 | 3.0% | |
| 2000 | 456,228 | 0.0% | |
| 2010 | 463,490 | 1.6% | |
| Est. 2017 | 469,818 | [7] | 1.4% |
| U.S. Decennial Census[8] 1790–1960[9] 1900–1990[10] 1990–2000[11] 2010–2013[1] | |||
2010 census
As of the 2010 United States Census, there were 463,490 people, 179,927 households, and 115,961 families residing in the county.[12] The population density was 751.0 inhabitants per square mile (290.0/km2). There were 192,175 housing units at an average density of 311.4 per square mile (120.2/km2).[13] The racial makeup of the county was 76.5% white, 9.0% black or African American, 2.0% Asian, 0.4% American Indian, 0.1% Pacific islander, 9.2% from other races, and 2.9% from two or more races. Those of Hispanic or Latino origin made up 20.9% of the population.[12] The largest ancestry groups were:[14]
- 17.9% Puerto Rican
- 17.4% Irish
- 12.7% French
- 11.0% Polish
- 10.8% Italian
- 8.8% English
- 6.0% German
- 5.5% French Canadian
- 2.6% American
- 2.2% Portuguese
- 2.0% Scottish
- 1.6% Russian
- 1.4% West Indian
- 1.3% Scotch-Irish
- 1.1% Swedish
Of the 179,927 households, 32.6% had children under the age of 18 living with them, 41.9% were married couples living together, 17.5% had a female householder with no husband present, 35.6% were non-families, and 29.2% of all households were made up of individuals. The average household size was 2.49 and the average family size was 3.09. The median age was 38.6 years.[12]
The median income for a household in the county was $47,724 and the median income for a family was $61,061. Males had a median income of $50,207 versus $37,765 for females. The per capita income for the county was $24,718. About 13.2% of families and 17.2% of the population were below the poverty line, including 26.5% of those under age 18 and 11.2% of those age 65 or over.[15]
Demographic breakdown by town
Income
The ranking of unincorporated communities that are included on the list are reflective if the census designated locations and villages were included as cities or towns. Data is from the 2007–2011 American Community Survey 5-Year Estimates.[16][17][18]
| Rank | Town | Per capita income |
Median household income |
Median family income |
Population | Number of households | |
|---|---|---|---|---|---|---|---|
| 1 | Longmeadow | Town | $50,203 | $100,092 | $111,803 | 15,772 | 5,605 |
| 2 | Wilbraham | Town | $39,372 | $88,839 | $107,871 | 14,145 | 5,393 |
| 3 | Hampden | Town | $38,396 | $79,773 | $103,173 | 5,134 | 1,960 |
| 4 | Montgomery | Town | $36,575 | $78,125 | $90,313 | 742 | 291 |
| 5 | Tolland | Town | $36,567 | $67,083 | $75,625 | 434 | 164 |
| 6 | Blandford | Town | $36,412 | $78,875 | $82,656 | 1,174 | 462 |
| Massachusetts | State | $35,051 | $65,981 | $83,371 | 6,512,227 | 2,522,409 | |
| 7 | East Longmeadow | Town | $34,417 | $76,517 | $89,570 | 15,555 | 5,660 |
| 8 | Southwick | Town | $33,753 | $74,721 | $86,915 | 9,425 | 3,657 |
| 9 | Wales | Town | $32,129 | $60,938 | $70,536 | 1,914 | 773 |
| 10 | Granville | Town | $32,050 | $71,667 | $85,625 | 1,444 | 554 |
| 11 | Brimfield | Town | $31,671 | $78,380 | $86,695 | 3,582 | 1,385 |
| 12 | Monson | Town | $31,274 | $70,485 | $86,333 | 8,531 | 3,318 |
| Monson Center | CDP | $29,938 | $50,242 | $51,691 | 1,880 | 846 | |
| 13 | Agawam | City | $29,914 | $65,339 | $76,258 | 28,408 | 11,506 |
| 14 | Holland | Town | $29,835 | $69,565 | $79,779 | 2,595 | 998 |
| 15 | West Springfield | City | $27,946 | $54,251 | $63,954 | 28,320 | 11,571 |
| United States | Country | $27,915 | $52,762 | $64,293 | 306,603,772 | 114,761,359 | |
| 16 | Palmer | City | $27,694 | $50,864 | $58,144 | 12,161 | 5,006 |
| 17 | Ludlow | Town | $27,644 | $60,694 | $73,048 | 21,131 | 7,876 |
| 18 | Chester | Town | $27,630 | $56,711 | $69,063 | 1,320 | 528 |
| 19 | Westfield | City | $26,605 | $53,772 | $72,210 | 41,025 | 15,207 |
| 20 | Russell | Town | $25,600 | $60,398 | $72,759 | 1,846 | 681 |
| Hampden County | County | $25,363 | $48,866 | $61,800 | 462,752 | 177,954 | |
| 21 | Chicopee | City | $23,703 | $45,763 | $58,118 | 55,205 | 23,136 |
| 22 | Holyoke | City | $20,370 | $33,915 | $42,033 | 39,897 | 16,012 |
| 23 | Springfield | City | $18,483 | $35,603 | $41,454 | 152,992 | 56,211 |
See also
References
- 1 2 "State & County QuickFacts". United States Census Bureau. Retrieved August 26, 2013.
- ↑ "Find a County". National Association of Counties. Retrieved June 7, 2011.
- ↑ Gannett, Henry (1905). The Origin of Certain Place Names in the United States. Govt. Print. Off. p. 148.
- ↑ "Registration and Party Enrollment Statistics as of October 13, 2010" (PDF). Massachusetts Elections Division. Retrieved March 14, 2010.
- ↑ Leip, David. "Dave Leip's Atlas of U.S. Presidential Elections". uselectionatlas.org. Retrieved 2018-03-29.
- ↑ "2010 Census Gazetteer Files". United States Census Bureau. August 22, 2012. Archived from the original on September 14, 2014. Retrieved September 16, 2014.
- ↑ "Population and Housing Unit Estimates". Retrieved June 21, 2018.
- ↑ "U.S. Decennial Census". United States Census Bureau. Retrieved September 16, 2014.
- ↑ "Historical Census Browser". University of Virginia Library. Retrieved September 16, 2014.
- ↑ "Population of Counties by Decennial Census: 1900 to 1990". United States Census Bureau. Retrieved September 16, 2014.
- ↑ "Census 2000 PHC-T-4. Ranking Tables for Counties: 1990 and 2000" (PDF). United States Census Bureau. Retrieved September 16, 2014.
- 1 2 3 "DP-1 Profile of General Population and Housing Characteristics: 2010 Demographic Profile Data". United States Census Bureau. Retrieved January 12, 2016.
- ↑ "Population, Housing Units, Area, and Density: 2010 – County". United States Census Bureau. Retrieved January 12, 2016.
- ↑ "DP02 Selected Social Characteristics in the United States – 2006–2010 American Community Survey 5-Year Estimates". United States Census Bureau. Retrieved January 12, 2016.
- ↑ "DP03 Selected Economic Characteristics – 2006–2010 American Community Survey 5-Year Estimates". United States Census Bureau. Retrieved January 12, 2016.
- ↑ "SELECTED ECONOMIC CHARACTERISTICS 2007–2011 American Community Survey 5-Year Estimates". U.S. Census Bureau. Retrieved January 26, 2013.
- ↑ "ACS DEMOGRAPHIC AND HOUSING ESTIMATES 2007–2011 American Community Survey 5-Year Estimates". U.S. Census Bureau. Retrieved January 26, 2013.
- ↑ "HOUSEHOLDS AND FAMILIES 2007–2011 American Community Survey 5-Year Estimates". U.S. Census Bureau. Retrieved January 26, 2013.
Further reading
- Copeland, Alfred (1902). "Our county and its people": a history of Hampden County, Massachusetts. Boston: Century Memorial Pub. Co. OCLC 3075222.
External links
| Wikimedia Commons has media related to Hampden County, Massachusetts. |
Places adjacent to Hampden County, Massachusetts | ||||||||||
|---|---|---|---|---|---|---|---|---|---|---|
| ||||||||||
Municipalities and communities of Hampden County, Massachusetts, United States | ||
|---|---|---|
| Cities | | |
| Towns | ||
| CDPs | ||
| Other villages | ||
| Footnotes | ‡This populated place also has portions in an adjacent county or counties | |
| Authority control |
|---|