Mississippi County, Missouri
Mississippi County is a county located in the Bootheel of the U.S. state of Missouri, with its eastern border formed by the Mississippi River. As of the 2010 census, the population was 14,358.[1] The largest city and county seat is Charleston.[2] The county was officially organized on February 14, 1845, and was named after the Mississippi River.[3]
Mississippi County | |
|---|---|
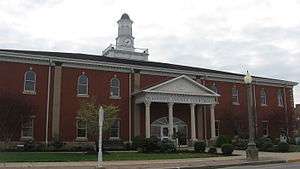 Mississippi County Courthouse | |
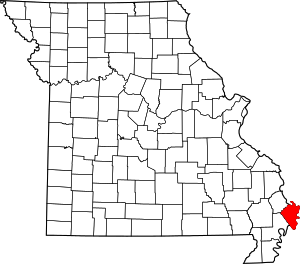 Location within the U.S. state of Missouri | |
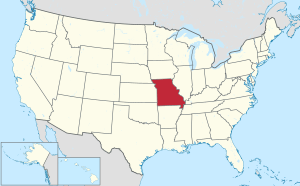 Missouri's location within the U.S. | |
| Coordinates: 36°50′N 89°17′W | |
| Country | |
| State | |
| Founded | February 14, 1845 |
| Named for | Mississippi River |
| Seat | Charleston |
| Largest city | Charleston |
| Area | |
| • Total | 429 sq mi (1,110 km2) |
| • Land | 412 sq mi (1,070 km2) |
| • Water | 17 sq mi (40 km2) 4.0% |
| Population (2010) | |
| • Total | 14,358 |
| • Estimate (2018) | 13,336 |
| • Density | 33/sq mi (13/km2) |
| Time zone | UTC−6 (Central) |
| • Summer (DST) | UTC−5 (CDT) |
| Congressional district | 8th |
| Website | Mississippi County, Missouri |
History
Mississippi County is located in what was formerly known as "Tywappity Bottom," a vast floodplain area bordered by the Scott County Hills on the north, St. James Bayou on the south, the Mississippi River on the east, and Little River on the west.
In 1540, the Spanish explorer Hernando De Soto penetrated to the Arkansas River and perhaps well into present-day southeastern Missouri, which was then populated by various Native American tribes, including the Osage. Under pressure from a constantly advancing white settlement, the Native Americans gradually retreated westward. The area of southeastern Missouri was noted for its level swampy lowlands, subject to the seasonal flooding of the Mississippi River, which had resulted in extremely fertile soil.
By 1820 American pioneers, many migrating from the southern states, had settled most of the present counties of southeastern Missouri. The settlers were primarily farmers who came from Illinois and the states of the Upper South: Virginia, Kentucky, and Tennessee. They were drawn by the fertile and cheap lands found in the area of present-day Charleston, Missouri. Cotton was cultivated through the 19th century, and the planters depended on enslaved African-American workers before the Civil War and freedmen afterward. There were marked adjustments as people adjusted to the free labor market.
The first American settlers reached what became Charleston in 1830. Seven years later, Thankful Randol sold Joseph Moore 22½ acres of land. Moore used it to lay out a plan for the city of Charleston. Its original boundary was 12 blocks square - four north and south, and three east and west. The Original Plat was filed on May 20, 1837. The General Assembly passed an act to incorporate the city of Charleston on March 25, 1872.
During the late 19th and early 20th centuries, violence increased against black Americans as the state disfranchised minority voters and enforce the Jim Crow segregation laws. Four African Americans were lynched in Mississippi county, the second-highest number in the state and tied with Callaway County.[4] Three of these murders took place in the county seat of Charleston. The fourth man was killed in Belmont, Missouri in 1905. Sam Fields and Robert Coleman were lynched in Charleston on July 3, 1910, allegedly for committing murder and robbery. The joint lynching was witnessed by a crowd of about 1,000.[5] Roosevelt Grigsby was lynched in Charleston in December 1924 by a mob of 200, who accused him of attempting to rape a woman.[5][6]
At the turn of the 20th century, the virgin forests attracted timber barons. Following the clearing of the timber, the state assisted in the construction of levees, forming drainage districts to redevelop the land. As hundreds of miles of levees and dikes were constructed within the Little River Drainage District, thousands of acres of land were drained and "reclaimed" for agricultural use. The reclaimed land, highly fertile due to centuries of flooding from the Mississippi River, was cultivated for cotton, corn, and wheat. Since the late 20th century, soybeans and rice have been important commodity crops and are grown on an industrial scale.
Geography

According to the U.S. Census Bureau, the county has a total area of 429 square miles (1,110 km2), of which 412 square miles (1,070 km2) is land and 17 square miles (44 km2) (4.0%) is water.[7]
Adjacent counties
- Alexander County, Illinois (north)
- Ballard County, Kentucky (northeast across the Mississippi River)
- Carlisle County, Kentucky (east across the river)
- Hickman County, Kentucky (southeast across the river)
- Fulton County, Kentucky (south across the river)
- New Madrid County (southwest)
- Scott County (northwest)
Mississippi County has borders across the river with four Kentucky counties, but it has no direct highway connection between any of them due to the mile-wide barrier of the river in this area. None of the four Kentucky counties that border Missouri has any direct highway connection with Missouri. Kentucky and Missouri are the only two U.S. states to border each other, even across a major river, without a direct highway connection between them. This reflects the relatively low populations among the river counties on both sides, which are largely rural in character. In early 2016, Mississippi County was declared as the poorest county in Missouri.[8]
Demographics
The rural county was at its peak of population in 1940. With changes in agriculture and mechanization requiring fewer workers, the number of jobs have declined, as has county population.
| Historical population | |||
|---|---|---|---|
| Census | Pop. | %± | |
| 1850 | 3,123 | — | |
| 1860 | 4,859 | 55.6% | |
| 1870 | 4,982 | 2.5% | |
| 1880 | 9,270 | 86.1% | |
| 1890 | 10,134 | 9.3% | |
| 1900 | 11,837 | 16.8% | |
| 1910 | 14,557 | 23.0% | |
| 1920 | 12,860 | −11.7% | |
| 1930 | 15,762 | 22.6% | |
| 1940 | 23,149 | 46.9% | |
| 1950 | 22,551 | −2.6% | |
| 1960 | 20,695 | −8.2% | |
| 1970 | 16,647 | −19.6% | |
| 1980 | 15,726 | −5.5% | |
| 1990 | 14,442 | −8.2% | |
| 2000 | 13,427 | −7.0% | |
| 2010 | 14,358 | 6.9% | |
| Est. 2018 | 13,336 | [9] | −7.1% |
| U.S. Decennial Census[10] 1790-1960[11] 1900-1990[12] 1990-2000[13] 2010-2015[1] | |||
As of the census[14] of 2000, there were 13,427 people, 5,383 households, and 3,671 families residing in the county. The population density was 32 people per square mile (13/km²). There were 5,840 housing units at an average density of 14 per square mile (5/km²). The racial makeup of the county was 77.93% White, 20.53% Black or African American, 0.25% Native American, 0.11% Asian, 0.01% Pacific Islander, 0.29% from other races, and 0.89% from two or more races. Approximately 0.96% of the population were Hispanic or Latino of any race.
There were 5,383 households out of which 31.20% had children under the age of 18 living with them, 47.70% were married couples living together, 17.30% had a female householder with no husband present, and 31.80% were non-families. 28.50% of all households were made up of individuals and 14.40% had someone living alone who was 65 years of age or older. The average household size was 2.44 and the average family size was 2.98.
In the county, the population was spread out with 26.30% under the age of 18, 8.80% from 18 to 24, 25.40% from 25 to 44, 23.60% from 45 to 64, and 15.90% who were 65 years of age or older. The median age was 37 years. For every 100 females there were 87.60 males. For every 100 females age 18 and over, there were 82.70 males.
The median income for a household in the county was $28,837, and the median income for a family was $35,554. Males had a median income of $26,110 versus $17,204 for females. The per capita income for the county was $16,847. About 19.00% of families and 23.70% of the population were below the poverty line, including 31.70% of those under age 18 and 21.70% of those age 65 or over.
Religion
According to the Association of Religion Data Archives County Membership Report (2000), Mississippi County is a part of the Bible Belt with evangelical Protestantism being the majority religion. The most predominant denominations among residents in Mississippi County who adhere to a religion are Southern Baptists (53.88%), Methodists (13.70%), and Christian Churches and Churches of Christ (7.55%).
Education
Of adults 25 years of age and older in Mississippi County, 61.1% possesses a high school diploma or higher while 9.6% holds a bachelor's degree or higher as their highest educational attainment.
Public schools
- Charleston R-I School District[15] - Charleston
- Warren E. Hearnes Elementary School (PK-05)
- Charleston Middle School (06-08)
- Charleston High School (09-12)
- East Prairie R-II School District[16] - East Prairie
- R.A. Doyle Elementary School (PK-02)
- A.J. Martin Elementary School (03-06)
- East Prairie Jr. High School (07-08)
- East Prairie High School (09-12)
Private schools
- St. Henry's School[17] - Charleston - (01-08) - Roman Catholic
Public libraries
- Mississippi County Library District[18]
Politics
The Democratic Party predominantly controls politics at the local level in Mississippi County. Democrats hold all but four of the elected positions in the county.
| Mississippi County, Missouri | ||||
|---|---|---|---|---|
| Elected countywide officials | ||||
| Assessor | Shirley Coffer | Democratic | ||
| Circuit Clerk | Dottie McKenzie | Democratic | ||
| County Clerk | Hubert DeLay, Jr. | Democratic | ||
| Collector | Ann McCuiston | Democratic | ||
| Commissioner (Presiding) |
Carlin Bennett | Republican | ||
| Commissioner (District 1) |
Mitch Pullen | Democratic | ||
| Commissioner (District 2) |
Darrell Jones | Republican | ||
| Coroner | Terry A. Parker | Democratic | ||
| Prosecuting Attorney | Darren Cann | Democratic | ||
| Public Administrator | Julie Summers-Day | Republican | ||
| Recorder | George Bays | Democratic | ||
| Sheriff | Britton Ferrell | Republican | ||
| Surveyor | Martin Lucas | Democratic | ||
| Treasurer | Sandra B. Morrow | Democratic | ||
State
Mississippi County is split in half by two different districts of the Missouri House of Representatives. The northern portion of the county is a part of House District 148 and is currently represented by State Representative Holly Rehder(R)[19] of Sikeston. The southern portion of the county is a part of House District 149 and is represented by State Representative Don Rone(R)[19] of Portageville.
All of Mississippi County is a part of Missouri's 29th District in the Missouri Senate and is currently represented by State Senator Doug Libla[20](R).
Federal
Mississippi County is included in Missouri’s 8th Congressional District and is represented by Jason T. Smith[21] (R-Salem) in the U.S. House of Representatives.
Political culture
| Year | Republican | Democratic | Third parties |
|---|---|---|---|
| 2016 | 69.7% 3,600 | 28.2% 1,458 | 2.2% 111 |
| 2012 | 60.9% 2,997 | 37.8% 1,858 | 1.3% 65 |
| 2008 | 56.7% 3,034 | 42.0% 2,247 | 1.4% 75 |
| 2004 | 54.8% 2,903 | 44.8% 2,374 | 0.4% 21 |
| 2000 | 45.9% 2,395 | 52.9% 2,756 | 1.2% 64 |
| 1996 | 30.4% 1,595 | 61.6% 3,235 | 8.0% 419 |
| 1992 | 29.5% 1,675 | 56.7% 3,226 | 13.8% 786 |
| 1988 | 44.0% 2,218 | 55.8% 2,814 | 0.2% 10 |
| 1984 | 49.8% 2,502 | 50.2% 2,524 | |
| 1980 | 44.1% 2,459 | 54.5% 3,040 | 1.4% 80 |
| 1976 | 33.9% 1,733 | 65.8% 3,366 | 0.3% 17 |
| 1972 | 65.0% 2,727 | 35.0% 1,470 | |
| 1968 | 26.8% 1,421 | 43.5% 2,303 | 29.7% 1,575 |
| 1964 | 29.3% 1,665 | 70.7% 4,015 | |
| 1960 | 40.6% 2,629 | 59.5% 3,855 | |
| 1956 | 36.6% 2,111 | 63.4% 3,653 | |
| 1952 | 35.4% 2,380 | 64.4% 4,331 | 0.3% 19 |
| 1948 | 21.9% 1,293 | 77.6% 4,592 | 0.5% 30 |
| 1944 | 31.6% 1,944 | 68.0% 4,182 | 0.4% 27 |
| 1940 | 41.2% 3,073 | 58.5% 4,362 | 0.4% 27 |
| 1936 | 37.9% 2,552 | 61.8% 4,160 | 0.4% 25 |
| 1932 | 34.7% 1,687 | 64.6% 3,136 | 0.7% 35 |
| 1928 | 43.4% 1,999 | 56.5% 2,602 | 0.2% 8 |
| 1924 | 41.7% 1,797 | 54.8% 2,360 | 3.6% 153 |
| 1920 | 46.9% 2,193 | 52.2% 2,442 | 0.9% 44 |
| 1916 | 40.8% 1,330 | 57.4% 1,874 | 1.8% 59 |
| 1912 | 39.5% 1,050 | 52.2% 1,388 | 8.3% 221 |
| 1908 | 44.8% 1,320 | 53.9% 1,589 | 1.4% 41 |
| 1904 | 47.4% 1,161 | 50.2% 1,229 | 2.4% 59 |
| 1900 | 42.0% 1,020 | 57.0% 1,384 | 1.0% 23 |
| 1896 | 39.0% 1,074 | 60.8% 1,673 | 0.2% 6 |
| 1892 | 35.7% 734 | 60.3% 1,240 | 4.0% 82 |
| 1888 | 37.0% 787 | 61.6% 1,312 | 1.4% 30 |
At the presidential level, Mississippi County is a fairly independent-leaning or battleground county. Most of the majority white population now support Republican presidential candidates, although they have voted for Democratic candidates with ties to the South, such as Al Gore and Bill Clinton. While George W. Bush carried Mississippi County in 2004, Al Gore won the county in 2000, although both times the margins of victory were significantly closer than in many of the other rural areas. Bill Clinton carried Mississippi County in both 1992 and 1996 by convincing double-digit margins. Like many of the other white-majority rural counties in Missouri, Mississippi County voters favored John McCain over Barack Obama in 2008, although the margin of victory was smaller than in most rural areas.
Voters in Mississippi County generally adhere to socially and culturally conservative principles but are more moderate or populist on economic issues, typical of what was formerly considered the white conservative Dixiecrat philosophy of southern Democrats, before African Americans regained the power to vote. In 2004, Missourians voted on a constitutional amendment to define marriage as the union between a man and a woman—it overwhelmingly passed in Mississippi County with 86.87 percent of the vote. The initiative passed the state with 71 percent of support from voters; Missouri became the first state to ban same-sex marriage. (This law was overturned as unconstitutional by a US Supreme Court decision.) In 2006, Missourians voted on a constitutional amendment to fund and legalize embryonic stem cell research in the state—it failed in Mississippi County with 57.35 percent voting against the measure. The initiative narrowly passed the state with 51 percent of support from voters; Missouri became one of the first states in the nation to approve embryonic stem cell research.
Despite Mississippi County’s longstanding tradition of supporting socially conservative platforms, voters in the county have a penchant for advancing populist causes such as increasing the minimum wage. In 2006, Missourians voted on a proposition (Proposition B) to increase the minimum wage in the state to $6.50 an hour—it passed Mississippi County with 75.66 percent of the vote. The proposition strongly passed every single county in Missouri, with 75.94 percent voting in favor as the minimum wage was increased to $6.50 an hour in the state.
Missouri presidential preference primary (2008)
During the 2008 presidential primary, voters in Mississippi County from both political parties supported candidates who finished in second place in the state at large and nationally.
- Former U.S. Senator Hillary Clinton (D-New York) received more votes, a total of 1,094, than any candidate from either party in Mississippi County during the 2008 presidential primary.
| Mississippi County, Missouri | |
|---|---|
| 2008 Republican primary in Missouri | |
| John McCain | 373 (33.73%) |
| Mike Huckabee | 471 (42.59%) |
| Mitt Romney | 226 (20.43%) |
| Ron Paul | 15 (1.36%) |
| Mississippi County, Missouri | |
|---|---|
| 2008 Democratic primary in Missouri | |
| Hillary Clinton | 1,094 (65.43%) |
| Barack Obama | 502 (30.02%) |
| John Edwards (withdrawn) | 57 (3.41%) |
Communities
- Anniston
- Bird's Point
- Bertrand
- Charleston (county seat)
- Deventer
- Dorena
- East Prairie
- Miner (mostly in Scott County)
- Pinhook
- Wilson City
- Wolf Island
- Wyatt
References
- "State & County QuickFacts". United States Census Bureau. Archived from the original on June 7, 2011. Retrieved September 10, 2013.
- "Find a County". National Association of Counties. Retrieved 2011-06-07.
- Eaton, David Wolfe (1916). How Missouri Counties, Towns and Streams Were Named. The State Historical Society of Missouri. pp. 330.
- Lynching in America/ Supplement: Lynchings by County, 3rd edition Archived 2017-10-23 at the Wayback Machine, Montgomery, Alabama: Equal Justice Initiative, 2015, p. 7
- Map of White Supremacy mob violence, 1835 - 1964, Monroe Work Today
- Danny Lewis, "This Map Shows Over a Century of Documented Lynchings in the United States", Smithsonian Magazine, 27 January 2017; accessed 12 April 2018
- "2010 Census Gazetteer Files". United States Census Bureau. August 22, 2012. Archived from the original on October 21, 2013. Retrieved November 16, 2014.
- "The Poorest County in Every State".
- "Population and Housing Unit Estimates". Retrieved November 15, 2019.
- "U.S. Decennial Census". United States Census Bureau. Retrieved November 16, 2014.
- "Historical Census Browser". University of Virginia Library. Retrieved November 16, 2014.
- "Population of Counties by Decennial Census: 1900 to 1990". United States Census Bureau. Retrieved November 16, 2014.
- "Census 2000 PHC-T-4. Ranking Tables for Counties: 1990 and 2000" (PDF). United States Census Bureau. Retrieved November 16, 2014.
- "U.S. Census website". United States Census Bureau. Retrieved 2008-01-31.
- "Charleston School District". Charleston School District.
- "East Prairie R-2 School District".
- Timothy Rolwing. "St. Henry Catholic Church, Charleston, Missouri, Welcomes You!".
- Breeding, Marshall. "Mississippi County Library District". Libraries.org. Retrieved May 8, 2017.
- "Missouri House of Representative - Members". house.mo.gov. Retrieved 2019-09-15.
- "Senator Doug Libla – Missouri Senate". www.senate.mo.gov. Retrieved 2019-09-15.
- "Legislative Branch". MO.gov. Retrieved 2019-09-15.
- Leip, David. "Dave Leip's Atlas of U.S. Presidential Elections". uselectionatlas.org. Retrieved 2018-03-25.
External links
| Wikimedia Commons has media related to Mississippi County, Missouri. |
- Digitized 1930 Plat Book of Mississippi County from University of Missouri Division of Special Collections, Archives, and Rare Books

Places adjacent to Mississippi County, Missouri | |
|---|---|
Municipalities and communities of Mississippi County, Missouri, United States | ||
|---|---|---|
| Cities | Map of Missouri highlighting Mississippi County | |
| Villages | ||
| Townships | ||
| Unincorporated communities | ||
| Ghost towns | ||
| Footnotes | ‡This populated place also has portions in an adjacent county or counties | |
| Authority control |
|
|---|