Putnam County, Missouri
Putnam County is a county located in North Central Missouri. As of the 2010 census, the population was 4,979.[1] Its county seat is Unionville.[2] The county was organized February 28, 1845 and named for Israel Putnam, a hero in the French and Indian War and a general in the American Revolutionary War.[3]
Putnam County | |
|---|---|
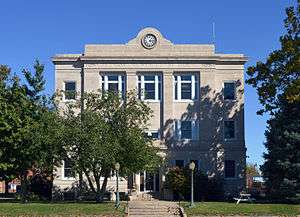 Putnam County Courthouse in Unionville | |
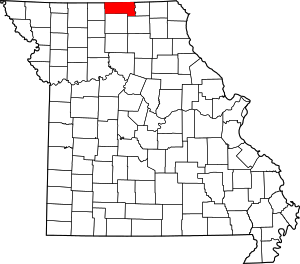 Location within the U.S. state of Missouri | |
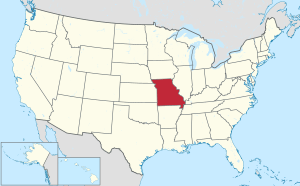 Missouri's location within the U.S. | |
| Coordinates: 40°29′N 93°01′W | |
| Country | |
| State | |
| Founded | February 28, 1845 |
| Named for | Israel Putnam |
| Seat | Unionville |
| Largest city | Unionville |
| Area | |
| • Total | 520 sq mi (1,300 km2) |
| • Land | 517 sq mi (1,340 km2) |
| • Water | 2.3 sq mi (6 km2) 0.4% |
| Population (2010) | |
| • Total | 4,979 |
| • Estimate (2018) | 4,757 |
| • Density | 9.6/sq mi (3.7/km2) |
| Time zone | UTC−6 (Central) |
| • Summer (DST) | UTC−5 (CDT) |
| Congressional district | 6th |
| Website | nemr |
Putnam County was established February 28, 1845 from parts of Adair and Sullivan counties. The following year a portion of Putnam was removed to form of Dodge County. Both Putnam and Dodge extended nearly nine miles further north until an 1851 ruling by the Supreme Court on a border dispute with Iowa assigned the contested land to Iowa. Both counties were left with less than the statutory minimum area for a county as set by the state legislature, so Dodge County was dissolved and its area added to Putnam.[4]
In its early years, the county seat changed frequently, often with contentious debate. Putnamville, Bryant Station (both no longer in existence), and Hartford all served until a central location called Harmony, later renamed Unionville, was chosen.[5]
In the 1860 U.S. Census Putnam County had 9,240 residents, with eighteen sawmills and three flour mills.[6] Coal had been an abundant since its earliest settlement. Following the arrival of the Burlington & Southwestern Railway in 1873, coal mining became a major industry, especially in the east of the county. At one time three railroads crossed Putnam county: the Chicago, Milwaukee and St. Paul; the Chicago, Burlington and Quincy; and the Iowa and St. Louis.[7] Putnam County lost over two-thirds of its population between the years 1900 and 2000 (see census data below), when the United States changed from a rural to an urban country.
Geography
According to the U.S. Census Bureau, the county has a total area of 520 square miles (1,300 km2), of which 517 square miles (1,340 km2) is land and 2.3 square miles (6.0 km2) (0.4%) is water.[8]
Adjacent counties
- Wayne County, Iowa (northwest)
- Appanoose County, Iowa (northeast)
- Schuyler County (east)
- Adair County (southeast)
- Sullivan County (south)
- Mercer County (west)
Demographics
| Historical population | |||
|---|---|---|---|
| Census | Pop. | %± | |
| 1850 | 1,636 | — | |
| 1860 | 9,207 | 462.8% | |
| 1870 | 11,217 | 21.8% | |
| 1880 | 13,555 | 20.8% | |
| 1890 | 15,365 | 13.4% | |
| 1900 | 16,668 | 8.5% | |
| 1910 | 14,308 | −14.2% | |
| 1920 | 13,115 | −8.3% | |
| 1930 | 11,503 | −12.3% | |
| 1940 | 11,327 | −1.5% | |
| 1950 | 9,166 | −19.1% | |
| 1960 | 6,999 | −23.6% | |
| 1970 | 5,916 | −15.5% | |
| 1980 | 6,092 | 3.0% | |
| 1990 | 5,079 | −16.6% | |
| 2000 | 5,223 | 2.8% | |
| 2010 | 4,979 | −4.7% | |
| Est. 2018 | 4,757 | [9] | −4.5% |
| U.S. Decennial Census[10] 1790-1960[11] 1900-1990[12] 1990-2000[13] 2010-2015[1] | |||
As of the census[14] of 2010, there were 4,979 people, 2,228 households, and 1,517 families residing in the county. The population density was 10 people per square mile (4/km²). There were 2,914 housing units at an average density of 6 per square mile (2/km²). The racial makeup of the county was 99.14% White, 0.06% Black or African American, 0.10% Native American, 0.13% Asian, 0.10% from other races, and 0.48% from two or more races. Approximately 0.61% of the population were Hispanic or Latino of any race.
There were 2,228 households out of which 27.90% had children under the age of 18 living with them, 57.20% were married couples living together, 7.20% had a female householder with no husband present, and 31.90% were non-families. 28.70% of all households were made up of individuals and 15.90% had someone living alone who was 65 years of age or older. The average household size was 2.32 and the average family size was 2.83.
In the county, the population was spread out with 24.00% under the age of 18, 6.20% from 18 to 24, 24.00% from 25 to 44, 25.10% from 45 to 64, and 20.70% who were 65 years of age or older. The median age was 42 years. For every 100 females there were 96.10 males. For every 100 females age 18 and over, there were 91.90 males.
The median income for a household in the county was $26,282, and the median income for a family was $32,031. Males had a median income of $22,957 versus $18,884 for females. The per capita income for the county was $14,647. About 13.20% of families and 16.00% of the population were below the poverty line, including 20.60% of those under age 18 and 12.80% of those age 65 or over.
- Pre-1900 data from A History of Northeast Missouri, Published 1913
Education
Public schools
- Putnam County R-I School District – Unionville
- Putnam County Elementary School (PK-05)
- Putnam County Middle School (06-08)
- Putnam County High School (09-12)
Public libraries
- Putnam County Public Library[15]
Politics
Local
The Republican Party predominantly controls politics at the local level in Putnam County. Republicans hold all but one of the elected positions in the county.
| Putnam County, Missouri | ||||
|---|---|---|---|---|
| Elected countywide officials | ||||
| Assessor | Paul L. Rouse | Republican | ||
| Circuit Clerk | Mitzi D. Shipley | Republican | ||
| County Clerk | Chrystal Perkins | Republican | ||
| Collector | Sharon Thompson Parks | Republican | ||
| Commissioner (Presiding) |
Randy Sands | Republican | ||
| Commissioner (District 1) |
Shane Bradshaw | Republican | ||
| Commissioner (District 2) |
Gerald Owings | Republican | ||
| Coroner | Jennifer Gilworth | Democratic | ||
| Prosecuting Attorney | Tom Keedy | Republican | ||
| Public Administrator | Nancy Mikels | Republican | ||
| Recorder | Jeneen Roof | Republican | ||
| Sheriff | Jason Knight | Republican | ||
| Surveyor | J. Scott Cline | Republican | ||
| Treasurer | Sharon Thompson Parks | Republican | ||
State
| Year | Republican | Democratic | Third Parties |
|---|---|---|---|
| 2016 | 73.84% 1,691 | 23.89% 547 | 2.27% 52 |
| 2012 | 65.53% 1,485 | 32.04% 726 | 2.43% 55 |
| 2008 | 64.43% 1,467 | 32.85% 748 | 2.72% 62 |
| 2004 | 72.75% 1,757 | 25.84% 624 | 1.41% 34 |
| 2000 | 66.42% 1,531 | 32.62% 752 | 0.95% 22 |
| 1996 | 41.71% 898 | 56.71% 1,332 | 1.58% 34 |
All of Putnam County is a part of Missouri’s 3rd District in the Missouri House of Representatives and is represented by Nate Walker (R-Kirksville).
| Party | Candidate | Votes | % | ± | |
|---|---|---|---|---|---|
| Republican | Nate Walker | 2,067 | 100.00% | ||
| Party | Candidate | Votes | % | ± | |
|---|---|---|---|---|---|
| Republican | Nate Walker | 1,059 | 100.00% | +30.20 | |
| Party | Candidate | Votes | % | ± | |
|---|---|---|---|---|---|
| Republican | Nate Walker | 1,597 | 69.80% | ||
| Democratic | Rebecca McClanahan | 691 | 30.20% | ||
All of Putnam County is a part of Missouri’s 12th District in the Missouri Senate and is currently represented by Dan Hegeman (R-Cosby).
| Party | Candidate | Votes | % | ± | |
|---|---|---|---|---|---|
| Republican | Dan Hegeman | 1,036 | 100.00% | ||
Federal
| Party | Candidate | Votes | % | ± | |
|---|---|---|---|---|---|
| Republican | Roy Blunt | 1,708 | 74.88% | +18.11 | |
| Democratic | Jason Kander | 486 | 21.31% | -17.89 | |
| Libertarian | Jonathan Dine | 46 | 2.02% | -2.01 | |
| Green | Johnathan McFarland | 24 | 1.05% | +1.05 | |
| Constitution | Fred Ryman | 17 | 0.74% | +0.74 | |
| Party | Candidate | Votes | % | ± | |
|---|---|---|---|---|---|
| Republican | Todd Akin | 1,296 | 56.77% | ||
| Democratic | Claire McCaskill | 895 | 39.20% | ||
| Libertarian | Jonathan Dine | 92 | 4.03% | ||
All of Putnam County is included in Missouri’s 6th Congressional District and is currently represented by Sam Graves (R-Tarkio) in the U.S. House of Representatives.
| Party | Candidate | Votes | % | ± | |
|---|---|---|---|---|---|
| Republican | Sam Graves | 1,897 | 84.01% | +0.52 | |
| Democratic | David M. Blackwell | 315 | 13.95% | -0.84 | |
| Libertarian | Russ Lee Monchil | 32 | 1.42% | -1.98 | |
| Green | Mike Diel | 14 | 0.62% | +0.62 | |
| Party | Candidate | Votes | % | ± | |
|---|---|---|---|---|---|
| Republican | Sam Graves | 1,032 | 83.49% | +3.36 | |
| Democratic | Bill Hedge | 162 | 13.11% | -4.22 | |
| Libertarian | Russ Lee Monchil | 42 | 3.40% | +0.86 | |
| Party | Candidate | Votes | % | ± | |
|---|---|---|---|---|---|
| Republican | Sam Graves | 1,799 | 80.13% | ||
| Democratic | Kyle Yarber | 389 | 17.33% | ||
| Libertarian | Russ Lee Monchil | 57 | 2.54% | ||
| Year | Republican | Democratic | Third parties |
|---|---|---|---|
| 2016 | 82.5% 1,936 | 15.1% 353 | 2.4% 57 |
| 2012 | 72.5% 1,673 | 25.4% 587 | 2.1% 49 |
| 2008 | 68.0% 1,591 | 29.7% 695 | 2.3% 53 |
| 2004 | 67.9% 1,660 | 31.6% 772 | 0.5% 13 |
| 2000 | 68.3% 1,593 | 30.3% 708 | 1.4% 33 |
| 1996 | 48.6% 1,091 | 38.2% 857 | 13.2% 297 |
| 1992 | 45.7% 1,143 | 33.5% 838 | 20.9% 522 |
| 1988 | 62.7% 1,365 | 36.9% 803 | 0.4% 8 |
| 1984 | 65.9% 1,540 | 34.1% 797 | |
| 1980 | 64.9% 1,722 | 32.8% 871 | 2.3% 62 |
| 1976 | 56.6% 1,444 | 43.0% 1,097 | 0.4% 9 |
| 1972 | 78.7% 2,112 | 21.3% 571 | |
| 1968 | 63.8% 1,971 | 30.8% 952 | 5.5% 169 |
| 1964 | 51.0% 1,547 | 49.0% 1,484 | |
| 1960 | 71.9% 2,711 | 28.1% 1,060 | |
| 1956 | 70.6% 2,674 | 29.4% 1,115 | |
| 1952 | 73.3% 3,202 | 26.3% 1,149 | 0.4% 17 |
| 1948 | 62.8% 2,499 | 36.8% 1,463 | 0.4% 15 |
| 1944 | 72.6% 3,106 | 27.3% 1,168 | 0.2% 7 |
| 1940 | 68.8% 3,828 | 30.7% 1,708 | 0.5% 25 |
| 1936 | 64.0% 3,458 | 35.2% 1,902 | 0.8% 42 |
| 1932 | 50.5% 2,180 | 46.1% 1,987 | 3.4% 148 |
| 1928 | 73.6% 3,498 | 26.2% 1,247 | 0.2% 10 |
| 1924 | 65.4% 3,340 | 29.3% 1,495 | 5.3% 273 |
| 1920 | 72.9% 3,880 | 24.7% 1,315 | 2.4% 126 |
| 1916 | 64.8% 2,106 | 31.9% 1,035 | 3.3% 107 |
| 1912 | 55.7% 1,859 | 28.0% 933 | 16.3% 545 |
| 1908 | 65.8% 2,233 | 31.1% 1,056 | 3.1% 106 |
| 1904 | 68.5% 2,226 | 25.3% 822 | 6.3% 204 |
| 1900 | 65.5% 2,337 | 32.5% 1,159 | 2.1% 74 |
| 1896 | 62.9% 2,363 | 36.6% 1,376 | 0.4% 16 |
| 1892 | 62.2% 2,027 | 34.7% 1,131 | 3.0% 99 |
| 1888 | 64.0% 1,985 | 33.7% 1,045 | 2.4% 74 |
Missouri presidential preference primary (2008)
| Putnam County, Missouri | |
|---|---|
| 2008 Republican primary in Missouri | |
| John McCain | 164 (28.08%) |
| Mike Huckabee | 253 (43.49%) |
| Mitt Romney | 128 (21.92%) |
| Ron Paul | 28 (4.79%) |
| Putnam County, Missouri | |
|---|---|
| 2008 Democratic primary in Missouri | |
| Hillary Clinton | 252 (64.62%) |
| Barack Obama | 120 (30.77%) |
| John Edwards (withdrawn) | 18 (4.62%) |
Former Governor Mike Huckabee (R-Arkansas) received more votes, a total of 253, than any candidate from either party in Putnam County during the 2008 presidential primary. He narrowly edged out former U.S. Senator Hillary Clinton (D-New York) for this title by just one vote.
See also
- National Register of Historic Places listings in Putnam County, Missouri
References
- "State & County QuickFacts". United States Census Bureau. Archived from the original on December 30, 2015. Retrieved September 12, 2013.
- "Find a County". National Association of Counties. Retrieved 2011-06-07.
- Eaton, David Wolfe (1917). How Missouri Counties, Towns and Streams Were Named. The State Historical Society of Missouri. pp. 343.
- Missouri State Historical Society marker, 1958
- "A Directory of Towns, Villages, and Hamlets of Missouri". thelibrary.org. Retrieved 2018-03-26.
- The Missouri Handbook by P.M. Pinckard. Published 1865
- A History of Northeast Missouri, Vol.1 Chapter 25. Published 1913.
- "2010 Census Gazetteer Files". United States Census Bureau. August 22, 2012. Archived from the original on October 21, 2013. Retrieved November 18, 2014.
- "Population and Housing Unit Estimates". Retrieved November 13, 2019.
- "U.S. Decennial Census". United States Census Bureau. Retrieved November 18, 2014.
- "Historical Census Browser". University of Virginia Library. Retrieved November 18, 2014.
- "Population of Counties by Decennial Census: 1900 to 1990". United States Census Bureau. Retrieved November 18, 2014.
- "Census 2000 PHC-T-4. Ranking Tables for Counties: 1990 and 2000" (PDF). United States Census Bureau. Retrieved November 18, 2014.
- "U.S. Census website". United States Census Bureau. Retrieved 2008-01-31.
- Breeding, Marshall. "Putnam County Public Library". Libraries.org. Retrieved May 8, 2017.
- Leip, David. "Dave Leip's Atlas of U.S. Presidential Elections". uselectionatlas.org. Retrieved 2018-03-26.
External links
- Digitized 1930 Plat Book of Putnam County from University of Missouri Division of Special Collections, Archives, and Rare Books
Places adjacent to Putnam County, Missouri | ||||||||||
|---|---|---|---|---|---|---|---|---|---|---|
| ||||||||||
Municipalities and communities of Putnam County, Missouri, United States | ||
|---|---|---|
| City | Map of Missouri highlighting Putnam County | |
| Villages | ||
| Townships |
| |
| CDP | ||
| Unincorporated communities | ||
| Ghost towns | ||