Buchanan County, Missouri
Buchanan County is located in the U.S. state of Missouri. As of the 2010 United States Census, the population was 89,201.[1] Its county seat is St. Joseph.[2] When originally formed in 1838, the county was named Roberts County, after settler Hiram Roberts. It was renamed in 1839 for James Buchanan, then a U.S. Senator and later President of the United States. The county was formed from land annexed to Missouri, as were five other counties.
Buchanan County | |
|---|---|
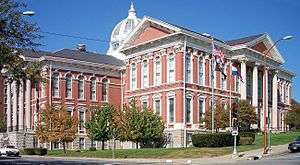 The Buchanan County Courthouse in downtown St. Joseph | |
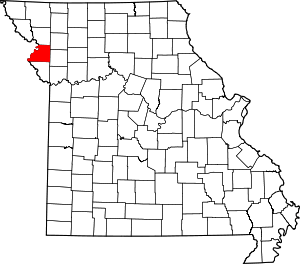 Location within the U.S. state of Missouri | |
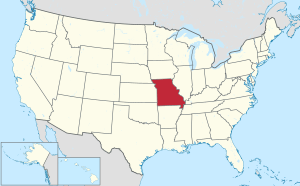 Missouri's location within the U.S. | |
| Coordinates: 39°40′N 94°49′W | |
| Country | |
| State | |
| Founded | December 31, 1838 |
| Named for | James Buchanan |
| Seat | St. Joseph |
| Largest city | St. Joseph |
| Area | |
| • Total | 415 sq mi (1,070 km2) |
| • Land | 408 sq mi (1,060 km2) |
| • Water | 6.6 sq mi (17 km2) 1.6% |
| Population (2010) | |
| • Total | 89,201 |
| • Estimate (2018) | 88,571 |
| • Density | 210/sq mi (83/km2) |
| Time zone | UTC−6 (Central) |
| • Summer (DST) | UTC−5 (CDT) |
| Congressional district | 6th |
| Website | www |
Buchanan County is included in the St. Joseph, Missouri Metropolitan Statistical Area.
Geography
According to the U.S. Census Bureau, the county has a total area of 415 square miles (1,070 km2), of which 408 square miles (1,060 km2) is land and 6.6 square miles (17 km2) (1.6%) is water.[3]
Adjacent counties
- Andrew County (north)
- DeKalb County (northeast)
- Clinton County (east)
- Platte County (south)
- Atchison County, Kansas (southwest)
- Doniphan County, Kansas (northwest)
Major highways
.svg.png)
.svg.png)


Demographics
| Historical population | |||
|---|---|---|---|
| Census | Pop. | %± | |
| 1840 | 6,237 | — | |
| 1850 | 12,975 | 108.0% | |
| 1860 | 23,861 | 83.9% | |
| 1870 | 35,109 | 47.1% | |
| 1880 | 49,792 | 41.8% | |
| 1890 | 70,100 | 40.8% | |
| 1900 | 121,838 | 73.8% | |
| 1910 | 93,020 | −23.7% | |
| 1920 | 93,684 | 0.7% | |
| 1930 | 98,633 | 5.3% | |
| 1940 | 94,067 | −4.6% | |
| 1950 | 96,826 | 2.9% | |
| 1960 | 90,581 | −6.4% | |
| 1970 | 86,915 | −4.0% | |
| 1980 | 87,888 | 1.1% | |
| 1990 | 83,083 | −5.5% | |
| 2000 | 85,998 | 3.5% | |
| 2010 | 89,201 | 3.7% | |
| Est. 2018 | 88,571 | [4] | −0.7% |
| U.S. Decennial Census[5] 1790-1960[6] 1900-1990[7] 1990-2000[8] 2010-2015[1] | |||
As of the census[9] of 2000, there were 85,998 people, 33,557 households, and 21,912 families residing in the county. The population density was 210 people per square mile (81/km²). There were 36,574 housing units at an average density of 89 per square mile (34/km²). The racial makeup of the county was 92.73% White, 4.36% Black or African American, 0.42% Native American, 0.45% Asian, 0.02% Pacific Islander, 0.65% from other races, and 1.37% from two or more races. Approximately 2.43% of the population were Hispanic or Latino of any race.
There were 33,557 households out of which 30.60% had children under the age of 18 living with them, 49.30% were married couples living together, 12.00% had a female householder with no husband present, and 34.70% were non-families. 28.90% of all households were made up of individuals and 12.50% had someone living alone who was 65 years of age or older. The average household size was 2.42 and the average family size was 2.98.
In the county, the population was spread out with 24.30% under the age of 18, 11.00% from 18 to 24, 28.50% from 25 to 44, 21.20% from 45 to 64, and 15.00% who were 65 years of age or older. The median age was 36 years. For every 100 females, there were 96.70 males. For every 100 females age 18 and over, there were 93.90 males.
The median income for a household in the county was $34,704, and the median income for a family was $42,408. Males had a median income of $31,697 versus $21,827 for females. The per capita income for the county was $17,882. About 8.50% of families and 12.20% of the population were below the poverty line, including 15.00% of those under age 18 and 9.60% of those age 65 or over.
Education
Public schools
- Buchanan County R-IV School District – De Kalb
- Rushville Elementary School (PK-06)
- De Kalb Junior/Senior High School (07-12)
- Mid-Buchanan County R-V School District – Faucett
- Mid-Buchanan County Elementary School (PK-06)
- Mid-Buchanan County High School (07-12)
- St. Joseph School District – St. Joseph
- Coleman Elementary School (K-06)
- Edison Elementary School (PK-06)
- Ellison Elementary School (K-06)
- Field Elementary School (K-06)
- Hall Elementary School (PK-06)
- Hosea Elementary School (PK-06)
- Humboldt Elementary School (PK-06)
- Hyde Elementary School (K-06)
- Lake Elementary School (PK-06)
- Lindbergh Elementary School (PK-06)
- Mark Twain Elementary School (K-06)
- Neely Elementary School (PK-06)
- Noyes Elementary School (PK-06)
- Parkway Elementary School (PK-06)
- Pershing Elementary School (K-06)
- Pickett Elementary School (PK-06)
- Skaith Elementary School (PK-06)
- Webster Elementary School (PK-06)
- Bode Middle School (07-08)
- Robidoux Middle School (07-08)
- Spring Garden Middle (07-08)
- Truman Middle School (07-08)
- Benton High School (09-12)
- Central High School (09-12)
- Lafayette High School (09-12)
Private schools
- Baptist Temple Schools – St. Joseph (K-12) – Baptist
- Cathedral School & Early Childhood Center – St. Joseph (NS/PK-08) – Roman Catholic
- Prescott Seventh-day Adventist School – St. Joseph (02-08) – Seventh-day Adventist
- St. Francis Xavier School – St. Joseph (K-09) – Roman Catholic
- St. James School – St. Joseph (K-09) – Roman Catholic
- St. Joseph Christian School – St. Joseph (PK-12) – Nondenominational Christian
- St. Paul Lutheran School – St. Joseph (K-09) – Lutheran
- St. Joseph KinderCare – St. Joseph (NS-PK)
- South Park Christian Academy – St. Joseph (K-12) – Pentecostal
- Bishop LeBlond High School – St. Joseph (09-12) – Roman Catholic
Politics
Local
The Democratic Party predominantly controls politics at the local level in Buchanan County. Democrats hold all but six of the elected positions in the county.
| Buchanan County, Missouri | ||||
|---|---|---|---|---|
| Elected countywide officials | ||||
| Assessor | Scot W. Van Meter | Democratic | ||
| Circuit Clerk | Ashley Thrasher | Republican | ||
| County Clerk | Mary Baack Garvey | Republican | ||
| Collector | Peggy Campbell | Democratic | ||
| Commissioner (Presiding) |
Lee Sawyer | Republican | ||
| Commissioner (District 1) |
Scott Burnham | Republican | ||
| Commissioner (District 2) |
Ron Hook | Democratic | ||
| Prosecuting Attorney | Ron Holliday | Democratic | ||
| Public Administrator | Megan Kennedy Stickley | Democratic | ||
| Recorder | Ed Wildberger | Democratic | ||
| Sheriff | Bill Puett | Republican | ||
| Treasurer | David Gall | Republican | ||
State
| Year | Republican | Democratic | Third Parties |
|---|---|---|---|
| 2016 | 52.60% 18,714 | 43.92% 15,628 | 3.48% 1.238 |
| 2012 | 39.61% 13,810 | 56.46% 19,685 | 3.92% 1,368 |
| 2008 | 37.39% 14,442 | 59.94% 23,151 | 2.67% 1,028 |
| 2004 | 50.03% 18,967 | 48.31% 18,317 | 1.66% 629 |
| 2000 | 45.18% 15,602 | 52.12% 17,998 | 2.70% 930 |
| 1996 | 29.76% 9,731 | 67.41% 22,045 | 2.83% 925 |
Buchanan County is divided into three legislative districts in the Missouri House of Representatives, two of which are held by Republicans and one by a Democrat.
- District 9 – Delus Johnson (R-St. Joseph). Consists of the eastern portion of the county.
| Party | Candidate | Votes | % | ± | |
|---|---|---|---|---|---|
| Republican | Delus Johnson | 8,398 | 100.00% | ||
| Party | Candidate | Votes | % | ± | |
|---|---|---|---|---|---|
| Republican | Delus Johnson | 5,165 | 100.00% | ||
| Party | Candidate | Votes | % | ± | |
|---|---|---|---|---|---|
| Republican | Delus Johnson | 8,051 | 100.00% | ||
- District 10 – Pat Conway (D-St. Joseph). The district is entirely based in the city of St. Joseph.
| Party | Candidate | Votes | % | ± | |
|---|---|---|---|---|---|
| Democratic | Pat Conway | 9,950 | 100.00% | ||
| Party | Candidate | Votes | % | ± | |
|---|---|---|---|---|---|
| Democratic | Pat Conway | 5,590 | 100.00% | ||
| Party | Candidate | Votes | % | ± | |
|---|---|---|---|---|---|
| Democratic | Pat Conway | 10,244 | 100.00% | ||
- District 11 – Galen Wayne Higdon, Jr (R-St. Joseph). Consists of the southern part of the county.
| Party | Candidate | Votes | % | ± | |
|---|---|---|---|---|---|
| Republican | Galen Wayne Higdon, Jr | 11,453 | 100.00% | ||
| Party | Candidate | Votes | % | ± | |
|---|---|---|---|---|---|
| Republican | Galen Wayne Higdon, Jr | 6,062 | 100.00% | ||
| Party | Candidate | Votes | % | ± | |
|---|---|---|---|---|---|
| Republican | Galen Wayne Higdon, Jr | 10,862 | 100.00% | ||
All of Buchanan County is a part of Missouri’s 34th District in the Missouri Senate and is currently represented by Tony Luetkemeyer (R-St. Joseph).
| Party | Candidate | Votes | % | ± | |
|---|---|---|---|---|---|
| Republican | Rob Schaaf | 11,068 | 53.69% | ||
| Democratic | Robert Stuber | 9,936 | 46.31% | ||
Federal
| Party | Candidate | Votes | % | ± | |
|---|---|---|---|---|---|
| Republican | Roy Blunt | 17,658 | 49.60% | +15.36 | |
| Democratic | Jason Kander | 16,103 | 45.23% | -13.50 | |
| Libertarian | Jonathan Dine | 1,043 | 2.93% | -4.10 | |
| Green | Johnathan McFarland | 515 | 1.45% | +1.45 | |
| Constitution | Fred Ryman | 282 | 0.79% | +0.79 | |
| Party | Candidate | Votes | % | ± | |
|---|---|---|---|---|---|
| Republican | Todd Akin | 11,913 | 34.24% | ||
| Democratic | Claire McCaskill | 20,437 | 58.73% | ||
| Libertarian | Jonathan Dine | 2,446 | 7.03% | ||
All of Buchanan County is included in Missouri’s 6th Congressional District and is currently represented by Sam Graves (R-Tarkio) in the U.S. House of Representatives.
| Party | Candidate | Votes | % | ± | |
|---|---|---|---|---|---|
| Republican | Sam Graves | 22,604 | 64.26% | +10.56 | |
| Democratic | David M. Blackwell | 11,196 | 31.83% | -10.75 | |
| Libertarian | Ross Lee Monchil | 878 | 2.50% | -1.22 | |
| Green | Mike Diel | 496 | 1.41% | +1.41 | |
| Party | Candidate | Votes | % | ± | |
|---|---|---|---|---|---|
| Republican | Sam Graves | 11,344 | 53.70% | -7.48 | |
| Democratic | Bill Hedge | 8,996 | 42.58% | +6.49 | |
| Libertarian | Russ Lee Monchil | 785 | 3.72% | -0.99 | |
| Party | Candidate | Votes | % | ± | |
|---|---|---|---|---|---|
| Republican | Sam Graves | 21,141 | 61.18% | ||
| Democratic | Kyle Yarber | 12,472 | 36.09% | ||
| Libertarian | Russ Lee Monchil | 944 | 2.73% | ||
| Year | Republican | Democratic | Third parties |
|---|---|---|---|
| 2016 | 59.3% 21,320 | 33.4% 12,013 | 7.3% 2,631 |
| 2012 | 53.2% 18,660 | 44.4% 15,594 | 2.4% 852 |
| 2008 | 48.7% 19,110 | 48.8% 19,164 | 2.5% 986 |
| 2004 | 52.2% 19,812 | 46.9% 17,799 | 0.9% 339 |
| 2000 | 47.3% 16,423 | 49.2% 17,085 | 3.6% 1,243 |
| 1996 | 38.2% 12,610 | 48.0% 15,848 | 13.8% 4,560 |
| 1992 | 30.2% 11,275 | 44.4% 16,570 | 25.5% 9,520 |
| 1988 | 45.0% 15,336 | 54.6% 18,601 | 0.5% 152 |
| 1984 | 56.2% 19,735 | 43.8% 15,369 | |
| 1980 | 47.1% 16,551 | 48.3% 16,967 | 4.6% 1,632 |
| 1976 | 48.2% 16,446 | 51.1% 17,427 | 0.7% 251 |
| 1972 | 65.7% 21,850 | 34.3% 11,395 | |
| 1968 | 46.4% 16,101 | 45.7% 15,860 | 7.9% 2,752 |
| 1964 | 32.3% 11,501 | 67.8% 24,164 | |
| 1960 | 52.6% 21,448 | 47.4% 19,348 | |
| 1956 | 52.5% 20,311 | 47.5% 18,384 | |
| 1952 | 52.6% 22,087 | 47.3% 19,854 | 0.1% 44 |
| 1948 | 36.1% 13,002 | 63.8% 22,975 | 0.2% 57 |
| 1944 | 42.9% 15,113 | 57.0% 20,091 | 0.1% 20 |
| 1940 | 41.6% 17,484 | 58.3% 24,482 | 0.1% 29 |
| 1936 | 35.4% 15,912 | 64.2% 28,825 | 0.4% 196 |
| 1932 | 35.7% 14,602 | 63.7% 26,060 | 0.6% 260 |
| 1928 | 62.7% 20,459 | 37.1% 12,110 | 0.2% 55 |
| 1924 | 50.1% 17,509 | 42.3% 14,759 | 7.6% 2,658 |
| 1920 | 51.0% 17,191 | 48.0% 16,188 | 1.0% 335 |
| 1916 | 40.6% 7,761 | 57.4% 10,973 | 2.1% 400 |
| 1912 | 26.5% 4,412 | 53.2% 8,869 | 20.4% 3,395 |
| 1908 | 45.3% 8,394 | 53.1% 9,836 | 1.5% 283 |
| 1904 | 51.6% 8,703 | 45.9% 7,736 | 2.5% 420 |
| 1900 | 47.5% 8,329 | 50.9% 8,925 | 1.6% 278 |
| 1896 | 47.8% 6,854 | 51.2% 7,336 | 1.0% 147 |
| 1892 | 42.9% 5,522 | 54.0% 6,949 | 3.1% 401 |
| 1888 | 43.2% 5,011 | 54.9% 6,369 | 1.9% 219 |
Missouri Presidential Preference Primary (2008)
- Former U.S. Senator Hillary Clinton (D-New York) received more votes, a total of 6,689, than any candidate from either party in Buchanan County during the 2008 presidential primary.
| Buchanan County, Missouri | |
|---|---|
| 2008 Republican primary in Missouri | |
| John McCain | 2,194 (31.63%) |
| Mike Huckabee | 1,825 (26.31%) |
| Mitt Romney | 2,216 (31.94%) |
| Ron Paul | 521 (7.51%) |
| Buchanan County, Missouri | |
|---|---|
| 2008 Democratic primary in Missouri | |
| Hillary Clinton | 6,689 (57.09%) |
| Barack Obama | 4,427 (37.78%) |
| John Edwards (withdrawn) | 413 (3.52%) |
| Uncommitted | {{{uncommitted}}} |
Communities
City
- St. Joseph (county seat)
See also
References
- "State & County QuickFacts". United States Census Bureau. Retrieved September 7, 2013.
- "Find a County". National Association of Counties. Archived from the original on 2011-05-31. Retrieved 2011-06-07.
- "2010 Census Gazetteer Files". United States Census Bureau. August 22, 2012. Archived from the original on October 21, 2013. Retrieved November 13, 2014.
- "Population and Housing Unit Estimates". Retrieved November 29, 2019.
- "U.S. Decennial Census". United States Census Bureau. Retrieved November 13, 2014.
- "Historical Census Browser". University of Virginia Library. Retrieved November 13, 2014.
- "Population of Counties by Decennial Census: 1900 to 1990". United States Census Bureau. Retrieved November 13, 2014.
- "Census 2000 PHC-T-4. Ranking Tables for Counties: 1990 and 2000" (PDF). United States Census Bureau. Retrieved November 13, 2014.
- "U.S. Census website". United States Census Bureau. Retrieved 2011-05-14.
- Breeding, Marshall. "Rolling Hills Consolidated Library -- Belt Branc". Libraries.org. Retrieved May 8, 2017.
- Breeding, Marshall. "Saint Joseph Public Library". Libraries.org. Retrieved May 8, 2017.
- Leip, David. "Dave Leip's Atlas of U.S. Presidential Elections". uselectionatlas.org. Retrieved 2018-03-24.
External links
- Buchanan County government's website
- St. Joseph Missouri City Directories
- St. Joseph Missouri Yearbook Indexes
- Digitized 1930 Plat Book of Buchanan County from University of Missouri Division of Special Collections, Archives, and Rare Books
Places adjacent to Buchanan County, Missouri | ||||||||||
|---|---|---|---|---|---|---|---|---|---|---|
| ||||||||||
Municipalities and communities of Buchanan County, Missouri, United States | ||
|---|---|---|
| Cities | Map of Missouri highlighting Buchanan County | |
| Villages | ||
| Townships | ||
| Unincorporated communities | ||
| Footnotes | ‡This populated place also has portions in an adjacent county or counties | |
| Authority control |
|
|---|