Chariton County, Missouri
Chariton County is a county located in the north-central portion of the U.S. state of Missouri. As of the 2010 census, the population was 7,831.[1] Its county seat is Keytesville.[2] The county was organized November 16, 1820, from part of Howard County and is named for the Chariton River.
Chariton County | |
|---|---|
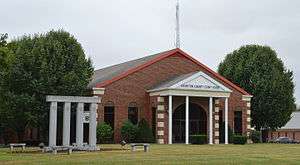 Chariton County Courthouse in Keytesville | |
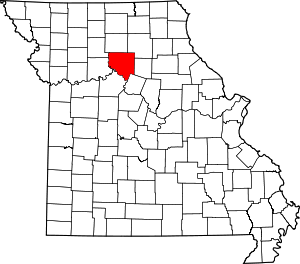 Location within the U.S. state of Missouri | |
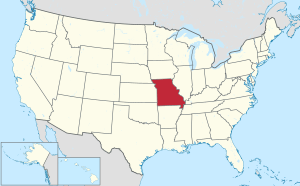 Missouri's location within the U.S. | |
| Coordinates: 39°31′N 92°58′W | |
| Country | |
| State | |
| Founded | November 16, 1820 |
| Named for | Chariton River |
| Seat | Keytesville |
| Largest city | Salisbury |
| Area | |
| • Total | 767 sq mi (1,990 km2) |
| • Land | 751 sq mi (1,950 km2) |
| • Water | 16 sq mi (40 km2) 2.0% |
| Population (2010) | |
| • Total | 7,831 |
| • Estimate (2018) | 7,451 |
| • Density | 10/sq mi (3.9/km2) |
| Time zone | UTC−6 (Central) |
| • Summer (DST) | UTC−5 (CDT) |
| Congressional district | 6th |
History

Chariton County was settled primarily from the states of the Upper South, especially Kentucky and Tennessee. They brought slaves and slaveholding traditions with them, and they quickly started cultivating crops similar to those in Middle Tennessee and Kentucky: hemp and tobacco. Chariton was one of several counties settled mostly by southerners to the north and south of the Missouri River. Given their culture and traditions, this area became known as Little Dixie and Chariton County was at its heart. It was heavily pro-Confederate during the American Civil War.[3]
Geography
According to the U.S. Census Bureau, the county has a total area of 767 square miles (1,990 km2), of which 751 square miles (1,950 km2) is land and 16 square miles (41 km2) (2.0%) is water.[4]
Adjacent counties
- Linn County (north)
- Macon County (northeast)
- Randolph County (east)
- Howard County (southeast)
- Saline County (southwest)
- Carroll County (west)
- Livingston County (northwest)
National protected area
Demographics
| Historical population | |||
|---|---|---|---|
| Census | Pop. | %± | |
| 1830 | 1,780 | — | |
| 1840 | 4,746 | 166.6% | |
| 1850 | 7,514 | 58.3% | |
| 1860 | 12,562 | 67.2% | |
| 1870 | 19,136 | 52.3% | |
| 1880 | 25,224 | 31.8% | |
| 1890 | 26,254 | 4.1% | |
| 1900 | 26,826 | 2.2% | |
| 1910 | 23,503 | −12.4% | |
| 1920 | 21,769 | −7.4% | |
| 1930 | 19,588 | −10.0% | |
| 1940 | 18,084 | −7.7% | |
| 1950 | 14,944 | −17.4% | |
| 1960 | 12,720 | −14.9% | |
| 1970 | 11,084 | −12.9% | |
| 1980 | 10,489 | −5.4% | |
| 1990 | 9,202 | −12.3% | |
| 2000 | 8,438 | −8.3% | |
| 2010 | 7,831 | −7.2% | |
| Est. 2018 | 7,451 | [5] | −4.9% |
| U.S. Decennial Census[6] 1790-1960[7] 1900-1990[8] 1990-2000[9] 2010-2015[1] | |||
As of the census[10] of 2000, there were 8,438 people, 3,469 households, and 2,345 families residing in the county. The population density was 11 people per square mile (4/km²). There were 4,250 housing units at an average density of 6 per square mile (2/km²). The racial makeup of the county was 95.99% White, 3.19% Black or African American, 0.17% Native American, 0.13% Asian, 0.11% from other races, and 0.41% from two or more races. Approximately 0.56% of the population were Hispanic or Latino of any race. 38.8% were of German, 25.5% American, 9.7% English and 7.8% Irish ancestry.
There were 3,469 households out of which 28.40% had children under the age of 18 living with them, 58.30% were married couples living together, 6.50% had a female householder with no husband present, and 32.40% were non-families. 29.80% of all households were made up of individuals and 17.30% had someone living alone who was 65 years of age or older. The average household size was 2.38 and the average family size was 2.94.
In the county, the population was spread out with 23.70% under the age of 18, 6.50% from 18 to 24, 23.70% from 25 to 44, 23.80% from 45 to 64, and 22.30% who were 65 years of age or older. The median age was 42 years. For every 100 females there were 91.90 males. For every 100 females age 18 and over, there were 91.30 males.
The median income for a household in the county was $32,285, and the median income for a family was $39,176. Males had a median income of $25,263 versus $19,068 for females. The per capita income for the county was $15,515. About 8.80% of families and 11.60% of the population were below the poverty line, including 11.40% of those under age 18 and 14.00% of those age 65 or over.
Education
Public schools
- Brunswick R-II School District – Brunswick
- Brunswick Elementary School (PK-06)
- Brunswick High School (07-12)
- Keytesville R-III School District – Keytesville
- Keytesville Elementary School (PK-06)
- Keytesville High School (07-12)
- Northwestern R-I School District – Mendon
- Northwestern Elementary School (PK-06)
- Northwestern High School (07-12)
- Salisbury R-IV School District – Salisbury
- Salisbury Elementary School (K-06)
- Salisbury High School (07-12)
Private schools
- St. Joseph School – Salisbury (K-09) – Roman Catholic
Politics
Local
The Democratic Party predominantly controls politics at the local level in Chariton County. Democrats hold all but two of the elected positions in the county.
| Chariton County, Missouri | ||||
|---|---|---|---|---|
| Elected countywide officials | ||||
| Assessor | Darrin E. Gladbach | Democratic | ||
| Circuit Clerk | Eric Stallo | Democratic | ||
| County Clerk | Susan Littleton | Democratic | ||
| Collector | Darlene Shipp | Democratic | ||
| Commissioner (Presiding) |
Evan Emmerich | Republican | ||
| Commissioner (District 1) |
Steve Adkinson | Democratic | ||
| Commissioner (District 2) |
Danny Price | Democratic | ||
| Coroner | Nyle Bowyer | Republican | ||
| Prosecuting Attorney | Cliff Thornburg | Democratic | ||
| Public Administrator | Regina Emmerich | Democratic | ||
| Recorder | Eric Stallo | Democratic | ||
| Sheriff | Rick Hershey | Democratic | ||
| Treasurer | Darlene Shipp | Democratic | ||
State
| Year | Republican | Democratic | Third Parties |
|---|---|---|---|
| 2016 | 59.61% 2,364 | 38.40% 1,523 | 1.99% 79 |
| 2012 | 46.59% 1,770 | 50.99% 1,937 | 2.42% 92 |
| 2008 | 46.54% 1,951 | 51.67% 2,166 | 1.79% 75 |
| 2004 | 54.32% 2,350 | 44.87% 1,941 | 0.81% 35 |
| 2000 | 48.47% 1,998 | 50.39% 2,077 | 1.14% 47 |
| 1996 | 33.31% 1,326 | 65.16% 2,594 | 1.53% 61 |
Chariton County is split between two districts in the Missouri House of Representatives, with both electing Republicans.
- District 39 – Joe Don McGaugh (R-Carrollton). Consists of the northern part of the county.
| Party | Candidate | Votes | % | ± | |
|---|---|---|---|---|---|
| Republican | Joe Don McGaugh | 2,507 | 100.00% | ||
| Party | Candidate | Votes | % | ± | |
|---|---|---|---|---|---|
| Republican | Joe Don McGaugh | 1,420 | 100.00% | +45.73 | |
| Party | Candidate | Votes | % | ± | |
|---|---|---|---|---|---|
| Republican | Joe Don McHaugh | 1,562 | 54.27% | ||
| Democratic | Will Talbert | 1,316 | 45.73% | ||
- District 48 – Dave Muntzel (R-Boonville). Consists of the southern part of the county.
| Party | Candidate | Votes | % | ± | |
|---|---|---|---|---|---|
| Republican | Dave Muntzel | 676 | 81.06% | -18.94 | |
| Independent | Debra Dilks | 158 | 18.94% | ||
| Party | Candidate | Votes | % | ± | |
|---|---|---|---|---|---|
| Republican | Dave Muntzel | 401 | 100.00% | +51.07 | |
| Party | Candidate | Votes | % | ± | |
|---|---|---|---|---|---|
| Republican | Dave Muntzel | 413 | 48.93% | ||
| Democratic | Ron Monnig | 431 | 51.07% | ||
All of Chariton County is a part of Missouri’s 18th District in the Missouri Senate and is currently represented by Brian Munzlinger (R-Williamstown).
| Party | Candidate | Votes | % | ± | |
|---|---|---|---|---|---|
| Republican | Brian Munzlinger | 1,781 | 100.00% | ||
Federal
| Party | Candidate | Votes | % | ± | |
|---|---|---|---|---|---|
| Republican | Roy Blunt | 2,322 | 58.64% | +13.93 | |
| Democratic | Jason Kander | 1,465 | 36.99% | -12.11 | |
| Libertarian | Jonathan Dine | 94 | 2.37% | -3.82 | |
| Green | Johnathan McFarland | 35 | 0.88% | +0.88 | |
| Constitution | Fred Ryman | 44 | 1.11% | +1.11 | |
| Party | Candidate | Votes | % | ± | |
|---|---|---|---|---|---|
| Republican | Todd Akin | 1,690 | 44.71% | ||
| Democratic | Claire McCaskill | 1,856 | 49.10% | ||
| Libertarian | Jonathan Dine | 234 | 6.19% | ||
All of Chariton County is included in Missouri’s 6th Congressional District and is currently represented by Sam Graves (R-Tarkio) in the U.S. House of Representatives.
| Party | Candidate | Votes | % | ± | |
|---|---|---|---|---|---|
| Republican | Sam Graves | 2,889 | 74.17% | +3.56 | |
| Democratic | David M. Blackwell | 894 | 22.95 | -2.32 | |
| Libertarian | Russ Lee Monchil | 72 | 1.85% | -2.27 | |
| Green | Mike Diel | 40 | 1.03% | +1.03 | |
| Party | Candidate | Votes | % | ± | |
|---|---|---|---|---|---|
| Republican | Sam Graves | 1,643 | 70.61% | +2.53 | |
| Democratic | Bill Hedge | 588 | 25.27% | -4.78 | |
| Libertarian | Russ Lee Monchil | 96 | 4.12% | +2.25 | |
| Party | Candidate | Votes | % | ± | |
|---|---|---|---|---|---|
| Republican | Sam Graves | 2,546 | 68.08% | ||
| Democratic | Kyle Yarber | 1,124 | 30.05% | ||
| Libertarian | Russ Lee Monchil | 70 | 1.87% | ||
| Year | Republican | Democratic | Third parties |
|---|---|---|---|
| 2016 | 74.3% 2,950 | 22.4% 888 | 3.3% 131 |
| 2012 | 62.9% 2,402 | 35.0% 1,339 | 2.1% 80 |
| 2008 | 55.5% 2,339 | 42.7% 1,799 | 1.8% 76 |
| 2004 | 55.8% 2,421 | 43.6% 1,892 | 0.6% 27 |
| 2000 | 55.4% 2,300 | 43.1% 1,792 | 1.5% 62 |
| 1996 | 37.4% 1,508 | 51.4% 2,072 | 11.2% 452 |
| 1992 | 30.0% 1,378 | 46.5% 2,141 | 23.5% 1,082 |
| 1988 | 48.1% 2,193 | 51.5% 2,347 | 0.3% 15 |
| 1984 | 55.0% 2,744 | 45.0% 2,244 | |
| 1980 | 53.1% 2,641 | 45.2% 2,250 | 1.7% 82 |
| 1976 | 40.9% 2,128 | 58.7% 3,055 | 0.4% 21 |
| 1972 | 58.5% 2,812 | 41.6% 1,999 | |
| 1968 | 45.5% 2,404 | 44.9% 2,371 | 9.6% 509 |
| 1964 | 33.3% 1,932 | 66.7% 3,862 | |
| 1960 | 46.6% 3,102 | 53.4% 3,550 | |
| 1956 | 48.5% 3,459 | 51.5% 3,671 | |
| 1952 | 50.9% 3,883 | 48.9% 3,730 | 0.2% 14 |
| 1948 | 38.5% 2,615 | 61.4% 4,170 | 0.1% 6 |
| 1944 | 49.1% 3,802 | 50.8% 3,930 | 0.1% 8 |
| 1940 | 46.7% 4,439 | 53.2% 5,053 | 0.1% 5 |
| 1936 | 38.3% 3,433 | 61.3% 5,490 | 0.4% 34 |
| 1932 | 24.9% 1,835 | 74.6% 5,498 | 0.5% 34 |
| 1928 | 46.2% 3,929 | 53.6% 4,559 | 0.2% 13 |
| 1924 | 38.7% 3,173 | 58.5% 4,795 | 2.8% 226 |
| 1920 | 47.7% 4,331 | 51.5% 4,675 | 0.9% 78 |
| 1916 | 40.6% 2,183 | 58.3% 3,135 | 1.1% 59 |
| 1912 | 27.9% 1,528 | 56.9% 3,112 | 15.2% 829 |
| 1908 | 39.8% 2,249 | 59.3% 3,352 | 0.9% 52 |
| 1904 | 39.4% 2,064 | 58.4% 3,058 | 2.3% 118 |
| 1900 | 35.3% 2,138 | 63.2% 3,828 | 1.6% 95 |
| 1896 | 35.2% 2,359 | 64.5% 4,321 | 0.3% 20 |
| 1892 | 36.0% 2,057 | 60.6% 3,463 | 3.5% 197 |
| 1888 | 39.7% 2,345 | 58.5% 3,452 | 1.9% 109 |
Missouri presidential preference primary (2008)
- Former U.S. Senator Hillary Clinton (D-New York) received more votes, a total of 786, than any candidate from either party in Chariton County during the 2008 presidential primary. She also received more votes than the total number of votes cast in the entire Republican primary in Chariton County.
| Chariton County, Missouri | |
|---|---|
| 2008 Republican primary in Missouri | |
| John McCain | 244 (34.41%) |
| Mike Huckabee | 260 (36.67%) |
| Mitt Romney | 167 (23.55%) |
| Ron Paul | 28 (3.95%) |
| Chariton County, Missouri | |
|---|---|
| 2008 Democratic primary in Missouri | |
| Hillary Clinton | 786 (61.60%) |
| Barack Obama | 402 (31.50%) |
| John Edwards (withdrawn) | 64 (5.02%) |
| Uncommitted | 13 (1.02%) |
Communities
Notable people
- Jane Hadley Barkley—former 2nd Lady of the U.S., wife of Alben Barkley. (Keytesville)
- Walt Disney—Film producer, animator, business leader. (Marceline)
- John Donaldson -- Negro league baseball pitcher. Known for pitching a large number of no-hitters. (Glasgow)
- J. William Fulbright—Longtime U.S. Senator and namesake of the Fulbright Scholarship. (Sumner)
- Cal Hubbard, -- Pro Football Hall of Fame member and former Major League Baseball umpire. (Keytesville)
- Vern Kennedy—Former Major League Baseball pitcher. (Mendon)
- Darold Knowles—Former MLB relief pitcher. First pitcher to ever appear in all seven games of a World Series. The baseball field at Brunswick R-II school is named in his honor. (Brunswick)
- Wayne E. Meyer—U.S. Navy admiral, "Father of the Aegis weapons system". (Brunswick)
- W. James Morgan—Union Army officer, responsible for the Burning of Platte City during the American Civil War. (Brunswick)
- Floyd B. Parks -- U.S. Marine aviator who earned the Navy Cross posthumously for his actions leading Marine fighter squadron VMF-221 during the Battle of Midway. (Salisbury)
- Sterling Price, - 11th Governor of Missouri. Confederate General in the Civil War (Keytesville)
- Sol Smith Russell—Comic stage actor of the late 19th century. Russell Opera House in Brunswick is named for him. (Brunswick)
- Wilbur Sweatman -- Ragtime and Dixieland jazz composer and performer. (Brunswick)
- Maxwell D. Taylor - U.S. Army general and diplomat. (Keytesville)
See also
References
- "State & County QuickFacts". United States Census Bureau. Retrieved September 7, 2013.
- "Find a County". National Association of Counties. Archived from the original on 2011-05-31. Retrieved 2011-06-07.
- "The Story of Little Dixie, Missouri" Archived 2012-07-17 at the Wayback Machine, Missouri Division - Sons of Confederate Veterans, accessed 3 June 2008
- "2010 Census Gazetteer Files". United States Census Bureau. August 22, 2012. Archived from the original on October 21, 2013. Retrieved November 14, 2014.
- "Population and Housing Unit Estimates". Retrieved November 29, 2019.
- "U.S. Decennial Census". United States Census Bureau. Retrieved November 14, 2014.
- "Historical Census Browser". University of Virginia Library. Retrieved November 14, 2014.
- "Population of Counties by Decennial Census: 1900 to 1990". United States Census Bureau. Retrieved November 14, 2014.
- "Census 2000 PHC-T-4. Ranking Tables for Counties: 1990 and 2000" (PDF). United States Census Bureau. Retrieved November 14, 2014.
- "U.S. Census website". United States Census Bureau. Retrieved 2011-05-14.
- Breeding, Marshall. "Brunswick Area Library". Libraries.org. Retrieved May 8, 2017.
- Breeding, Marshall. "Dulany Memorial Library". Libraries.org. Retrieved May 8, 2017.
- Breeding, Marshall. "Keytesville Public Library". Libraries.org. Retrieved May 8, 2017.
- Leip, David. "Dave Leip's Atlas of U.S. Presidential Elections". uselectionatlas.org. Retrieved 2018-03-24.
Further reading
- History of Howard and Chariton Counties, Missouri (1883) full text
External links
- Digitized 1930 Plat Book of Chariton County from University of Missouri Division of Special Collections, Archives, and Rare Books
Places adjacent to Chariton County, Missouri | ||||||||||
|---|---|---|---|---|---|---|---|---|---|---|
| ||||||||||
Municipalities and communities of Chariton County, Missouri, United States | ||
|---|---|---|
| Cities | Map of Missouri highlighting Chariton County | |
| Villages | ||
| Townships | ||
| Unincorporated communities | ||
| Footnotes | ‡This populated place also has portions in an adjacent county or counties | |
| Authority control |
|
|---|