Platte County, Missouri
Platte County is a county located in the northwestern portion of the U.S. state of Missouri and is part of the Kansas City metropolitan area. As of the 2010 census, the population was 89,322.[1] Its county seat is Platte City.[2] The county was organized December 31, 1838,[3] from the Platte Purchase,[4] named for the Platte River. (Platte is derived from the French word for a low, shallow, or intermittent stream. The Kansas City International Airport is located in the county, approximately one mile west of Interstate 29 between mile markers 12 and 15. The land for the airport was originally in an unincorporated portion of Platte County before being annexed by Platte City, and eventually Kansas City.
Platte County | |
|---|---|
 Platte County Courthouse | |
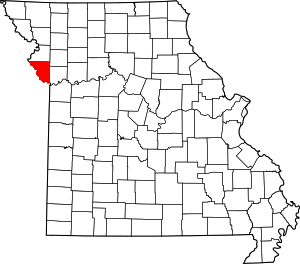 Location within the U.S. state of Missouri | |
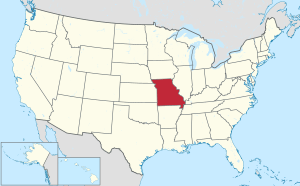 Missouri's location within the U.S. | |
| Coordinates: 39°23′N 94°46′W | |
| Country | |
| State | |
| Founded | December 31, 1838 |
| Named for | Platte River or Platte Purchase |
| Seat | Platte City |
| Largest city | Kansas City |
| Area | |
| • Total | 427 sq mi (1,110 km2) |
| • Land | 420 sq mi (1,100 km2) |
| • Water | 6.6 sq mi (17 km2) 1.5% |
| Population (2010) | |
| • Total | 89,322 |
| • Estimate (2019) | 104,418 |
| • Density | 210/sq mi (81/km2) |
| Time zone | UTC−6 (Central) |
| • Summer (DST) | UTC−5 (CDT) |
| Congressional district | 6th |
| Website | www |
Geography
According to the U.S. Census Bureau, the county has a total area of 427 square miles (1,110 km2), of which 420 square miles (1,100 km2) is land and 6.6 square miles (17 km2) (1.5%) is water.[5] The county's southwestern border with Kansas is formed by the Missouri River.
Adjacent counties
- Buchanan County (north)
- Clinton County (northeast)
- Clay County (east)
- Wyandotte County, Kansas (south)
- Leavenworth County, Kansas (southwest)
- Atchison County, Kansas (northwest)
Demographics
| Historical population | |||
|---|---|---|---|
| Census | Pop. | %± | |
| 1840 | 8,913 | — | |
| 1850 | 16,845 | 89.0% | |
| 1860 | 18,350 | 8.9% | |
| 1870 | 17,352 | −5.4% | |
| 1880 | 17,366 | 0.1% | |
| 1890 | 16,278 | −6.3% | |
| 1900 | 16,193 | −0.5% | |
| 1910 | 14,429 | −10.9% | |
| 1920 | 13,996 | −3.0% | |
| 1930 | 13,819 | −1.3% | |
| 1940 | 13,862 | 0.3% | |
| 1950 | 14,973 | 8.0% | |
| 1960 | 23,350 | 55.9% | |
| 1970 | 32,081 | 37.4% | |
| 1980 | 46,341 | 44.4% | |
| 1990 | 57,867 | 24.9% | |
| 2000 | 73,781 | 27.5% | |
| 2010 | 89,322 | 21.1% | |
| Est. 2018 | 102,985 | [6] | 15.3% |
| U.S. Decennial Census[7] 1790-1960[8] 1900-1990[9] 1990-2000[10] 2010-2015[1] | |||
As of the census[11] of 2000, there were 73,781 people, 29,278 households, and 20,231 families residing in the county. The population density was 176 people per square mile (68/km²). There were 30,902 housing units at an average density of 74 per square mile (28/km²). The racial makeup of the county was 91.45% White, 3.49% Black or African American, 0.46% Native American, 1.48% Asian, 0.20% Pacific Islander, 1.05% from other races, and 1.87% from two or more races. Approximately 3.00% of the population were Hispanic or Latino of any race. 23.4% were of German, 12.5% Irish, 12.2% American and 11.4% English ancestry.
There were 29,278 households out of which 34.10% had children under the age of 18 living with them, 57.00% were married couples living together, 8.80% had a female householder with no husband present, and 30.90% were non-families. 24.90% of all households were made up of individuals and 6.00% had someone living alone who was 65 years of age or older. The average household size was 2.49 and the average family size was 3.00.
In the county, the population was spread out with 25.80% under the age of 18, 8.30% from 18 to 24, 32.60% from 25 to 44, 24.50% from 45 to 64, and 8.80% who were 65 years of age or older. The median age was 36 years. For every 100 females there were 98.10 males. For every 100 females age 18 and over, there were 95.50 males.
The median income for a household in the county was $55,849, and the median income for a family was $65,236. Males had a median income of $44,310 versus $31,005 for females. The per capita income for the county was $26,356. About 3.30% of families and 4.80% of the population were below the poverty line, including 5.70% of those under age 18 and 5.70% of those age 65 or over.
Education
Public schools
- North Platte County R-I School District – Dearborn
- North Platte County Elementary School (PK-03)
- North Platte County Intermediate School (04-06)
- North Platte County Junior High School (07-08)
- North Platte County High School (09-12)
- Park Hill School District – Kansas City
- Russell Jones Education Center (K-12) – (Special Education)
- Hopewell Elementary School (K-05)
- Alfred L. Renner Elementary School (K-05)
- Thomas B. Chinn Elementary School (K-05)
- English Landing Elementary School (K-05)
- Graden Elementary School (K-05)
- Hawthorn Elementary School (K-05)
- Line Creek Elementary School (K-05)
- Gerner Family Early Education Center (PK)
- Prairie Point Elementary School (K-05)
- Southeast Elementary School (K-05)
- Tiffany Ridge Elementary School (K-05)
- Union Chapel Elementary School (K-05)
- Congress Middle School (06-08)
- Lakeview Middle School (06-08)
- Plaza Middle School (06-08)
- Walden Middle School (06-08)
- Park Hill High School (09-12) -- within Kansas City city limits
- Park Hill South High School (09-12) – Riverside
- LEAD Innovation Studio (09-12)
- Platte County R-III School District – Platte City
- Donald D. Siegrist Elementary School (K-5)
- Pathfinder Elementary School (PK-02)
- Compass Elementary School (K-5)
- Barry Elementary School (03-08)
- Platte City Middle School (06-08)
- Platte County High School (09-12)
- West Platte County R-II School District – Weston
- Central Elementary School (PK-06)
- West Platte County High School (07-12)
Private schools
- Clay-Platte Children’s House Montessori School – Kansas City (PK-08) – Nonsectarian
- Martin Luther Academy – Kansas City (K-08) – Lutheran
- Northland Christian Education System – Kansas City (PK-12) – Nondenominational Christian
- St. Therese School – Kansas City (K-08) – Roman Catholic
- St. Pius X High School – Kansas City (09-12) – Roman Catholic
- Prairie View KinderCare – Kansas City (NS/PK) – Nonsectarian
- Christ Lutheran Pre-Kindergarten School – Platte Woods (NS/PK) – Lutheran
- Our Savior Christian Academy - Platte City and Smithville (PK-12)
Public libraries
Politics
Local
The Republican Party controls politics at the local level in Platte County. Republicans hold all of the elected positions in the county. However, Governor Jay Nixon carried the county in his two successful elections, and in 2004, Claire McCaskill of Jackson County narrowly won a majority of the county's votes over Republican victor Matt Blunt.
| Platte County, Missouri | ||||
|---|---|---|---|---|
| Elected countywide officials | ||||
| Assessor | David Cox | Republican | ||
| County Clerk | Nancy Armstrong | Republican | ||
| Collector | Sheila Palmer | Republican | ||
| Commissioner (Presiding) |
Ron Schieber | Republican | ||
| Commissioner (District 1) |
Dagmar Wood | Republican | ||
| Commissioner (District 2) |
John Elliott | Republican | ||
| Prosecuting Attorney | Eric Zahnd | Republican | ||
| Public Administrator | Jera Pruitt | Republican | ||
| Recorder | Gloria Boyer | Republican | ||
| Sheriff | Mark Owen | Republican | ||
| Treasurer | Rob Willard | Republican | ||
State
| Year | Republican | Democratic | Third Parties |
|---|---|---|---|
| 2016 | 50.20% 24,738 | 46.62% 22,973 | 2.58% 1,269 |
| 2012 | 44.64% '20,154 | 52.39% 23,654 | 2.97% 1,339 |
| 2008 | 42.51% 19,417 | 55.23% 25,228 | 2.26% 1,032 |
| 2004 | 48.31% 20,137 | 50.31% 20,970 | 1.32% 577 |
| 2000 | 50.23% 16,971 | 47.69% 16,115 | 2.08% 703 |
| 1996 | 36.40% 10,581 | 61.37% 17,840 | 2.23% 647 |
Platte County is divided into four legislative districts in the Missouri House of Representatives, three held by Republicans and one held by a Democrat.
- District 11 — Galen Wayne Higdon, Jr. (R-St. Joseph). Consists of the communities of Dearborn, Edgerton, Tracy, and Weston.
| Party | Candidate | Votes | % | ± | |
|---|---|---|---|---|---|
| Republican | Galen Wayne Higdon, Jr. | 2,690 | 100.00% | ||
| Party | Candidate | Votes | % | ± | |
|---|---|---|---|---|---|
| Republican | Galen Wayne Higdon, Jr. | 1,298 | 100.00% | ||
| Party | Candidate | Votes | % | ± | |
|---|---|---|---|---|---|
| Republican | Galen Wayne Higdon, Jr. | 2,454 | 100.00% | ||
- District 12 — Kenneth Wilson (R-Smithville). Consists of Camden Point, Platte City, and Ridgely.
| Party | Candidate | Votes | % | ± | |
|---|---|---|---|---|---|
| Republican | Kenneth Wilson | 3,125 | 62.75% | -3.10 | |
| Democratic | Sandy Van Wagner | 1,696 | 34.06% | -0.09 | |
| Libertarian | Glenn Gustitus | 159 | 3.19% | +3.19 | |
| Party | Candidate | Votes | % | ± | |
|---|---|---|---|---|---|
| Republican | Kenneth Wilson | 1,666 | 65.85% | -34.15 | |
| Democratic | Sandy Van Wagner | 864 | 34.15% | +34.15 | |
| Party | Candidate | Votes | % | ± | |
|---|---|---|---|---|---|
| Republican | Kenneth Wilson | 4,025 | 100.00% | ||
- District 13 — Nick Marshall (R-Parkville). Consists of the communities of Farley, Ferrelview, Parkville, Waldron, Weatherby Lake, and a part of the city of Kansas City.
| Party | Candidate | Votes | % | ± | |
|---|---|---|---|---|---|
| Republican | Nick Marshall | 12,440 | 59.02% | -40.98 | |
| Democratic | Tyler McCall | 8,636 | 40.98% | +40.98 | |
| Party | Candidate | Votes | % | ± | |
|---|---|---|---|---|---|
| Republican | Nick Marshall | 7,539 | 100.00% | +38.04 | |
| Party | Candidate | Votes | % | ± | |
|---|---|---|---|---|---|
| Republican | Nick Marshall | 11,712 | 61.96% | ||
| Democratic | Gerry Byrne | 7,192 | 38.04 | ||
- District 14 – Matt Sain (D-Kansas City). Consists of the communities of Houston Lake, Lake Waukomis, Northmoor, Platte Woods, Riverside, and part of the city of Kansas City.
| Party | Candidate | Votes | % | ± | |
|---|---|---|---|---|---|
| Republican | Kevin Corlew | 8,716 | 50.17% | -2.49 | |
| Democratic | Matt Sain | 8,656 | 49.83% | +2.49 | |
| Party | Candidate | Votes | % | ± | |
|---|---|---|---|---|---|
| Republican | Kevin Corlew | 10,084 | 52.66% | -3.55 | |
| Democratic | Martin T. Rucker II | 9,067 | 47.34% | +3.55 | |
| Party | Candidate | Votes | % | ± | |
|---|---|---|---|---|---|
| Republican | Kevin Corlew | 4,812 | 56.21% | +1.40 | |
| Democratic | Stephanie Isaacson | 3,749 | 43.79 | -1.40 | |
| Party | Candidate | Votes | % | ± | |
|---|---|---|---|---|---|
| Republican | Ron Schieber | 9,459 | 54.81% | ||
| Democratic | Eric Pendell | 7,799 | 45.19% | ||
All of Platte County is a part of Missouri's 34th District in the Missouri Senate and is currently represented by Rob Schaaf (R-St. Joseph).
| Party | Candidate | Votes | % | ± | |
|---|---|---|---|---|---|
| Republican | Rob Schaaf | 13,071 | 59.26% | ||
| Democratic | Martin T. Rucker | 8,987 | 40.74% | ||
Federal
| Party | Candidate | Votes | % | ± | |
|---|---|---|---|---|---|
| Republican | Roy Blunt | 22,929 | 46.76% | +6.99 | |
| Democratic | Jason Kander | 23,795 | 48.52% | -3.96 | |
| Libertarian | Jonathan Dine | 1,413 | 2.88% | -4.87 | |
| Green | Johnathan McFarland | 530 | 1.08% | +1.08 | |
| Constitution | Fred Ryman | 371 | 0.76% | +0.76 | |
| Party | Candidate | Votes | % | ± | |
|---|---|---|---|---|---|
| Republican | Todd Akin | 17,870 | 39.77% | ||
| Democratic | Claire McCaskill | 23,578 | 52.48% | ||
| Libertarian | Jonathan Dine | 3,480 | 7.75% | ||
All of Platte County is included in Missouri's 6th Congressional District and is currently represented by Sam Graves (R-Tarkio) in the U.S. House of Representatives.
| Party | Candidate | Votes | % | ± | |
|---|---|---|---|---|---|
| Republican | Sam Graves | 29,596 | 60.91% | -1.12 | |
| Democratic | David M. Blackwell | 17,016 | 35.02% | +1.33 | |
| Libertarian | Russ Lee Monchil | 1,321 | 2.72% | -1.56 | |
| Green | Mike Diel | 653 | 1.34% | +1.34 | |
| Party | Candidate | Votes | % | ± | |
|---|---|---|---|---|---|
| Republican | Sam Graves | 13,780 | 62.03% | -0.01 | |
| Democratic | Bill Hedge | 7,483 | 33.69% | -1.66 | |
| Libertarian | Russ Lee Monchil | 951 | 4.28% | +1.67 | |
| Party | Candidate | Votes | % | ± | |
|---|---|---|---|---|---|
| Republican | Sam Graves | 27,641 | 62.04% | ||
| Democratic | Kyle Yarber | 15,753 | 35.35% | ||
| Libertarian | Russ Lee Monchil | 1,162 | 2.61% | ||
| Year | Republican | Democratic | Third parties |
|---|---|---|---|
| 2016 | 52.3% 25,933 | 40.4% 20,057 | 7.3% 3,618 |
| 2012 | 56.0% 25,618 | 42.0% 19,175 | 2.0% 917 |
| 2008 | 52.4% 24,460 | 46.0% 21,459 | 1.6% 721 |
| 2004 | 55.5% 23,302 | 43.9% 18,412 | 0.6% 256 |
| 2000 | 52.2% 17,785 | 45.0% 15,325 | 2.8% 944 |
| 1996 | 45.4% 13,332 | 43.2% 12,705 | 11.4% 3,352 |
| 1992 | 31.8% 9,380 | 37.0% 10,920 | 31.1% 9,178 |
| 1988 | 51.2% 11,838 | 48.5% 11,225 | 0.3% 66 |
| 1984 | 62.6% 12,859 | 37.4% 7,668 | |
| 1980 | 53.8% 10,092 | 39.1% 7,342 | 7.1% 1,322 |
| 1976 | 47.5% 8,103 | 50.7% 8,651 | 1.8% 300 |
| 1972 | 67.7% 8,764 | 32.3% 4,183 | |
| 1968 | 42.7% 4,836 | 41.2% 4,665 | 16.0% 1,815 |
| 1964 | 33.2% 3,059 | 66.8% 6,143 | |
| 1960 | 44.9% 4,771 | 55.1% 5,860 | |
| 1956 | 40.6% 3,596 | 59.5% 5,271 | |
| 1952 | 42.4% 3,390 | 57.5% 4,604 | 0.1% 9 |
| 1948 | 27.3% 1,644 | 72.4% 4,354 | 0.3% 16 |
| 1944 | 38.5% 2,344 | 61.4% 3,741 | 0.1% 8 |
| 1940 | 35.4% 2,545 | 64.4% 4,635 | 0.2% 13 |
| 1936 | 26.7% 1,787 | 73.0% 4,884 | 0.3% 20 |
| 1932 | 18.2% 1,160 | 81.5% 5,179 | 0.3% 19 |
| 1928 | 41.9% 2,423 | 57.9% 3,344 | 0.2% 10 |
| 1924 | 34.8% 1,999 | 64.0% 3,674 | 1.2% 71 |
| 1920 | 28.3% 1,724 | 71.5% 4,361 | 0.3% 17 |
| 1916 | 23.5% 921 | 76.0% 2,974 | 0.5% 20 |
| 1912 | 14.8% 510 | 73.6% 2,535 | 11.6% 400 |
| 1908 | 25.8% 982 | 73.5% 2,795 | 0.6% 24 |
| 1904 | 27.1% 953 | 72.0% 2,537 | 0.9% 32 |
| 1900 | 24.5% 997 | 74.9% 3,052 | 0.7% 28 |
| 1896 | 24.5% 1,044 | 74.8% 3,191 | 0.7% 31 |
| 1892 | 23.7% 885 | 71.4% 2,664 | 4.9% 183 |
| 1888 | 26.8% 1,010 | 72.2% 2,727 | 1.0% 38 |
Missouri presidential preference primary (2008)
| Platte County, Missouri | |
|---|---|
| 2008 Republican primary in Missouri | |
| John McCain | 2,793 (33.49%) |
| Mike Huckabee | 1,825 (21.88%) |
| Mitt Romney | 3,109 (37.27%) |
| Ron Paul | 472 (5.66%) |
| Platte County, Missouri | |
|---|---|
| 2008 Democratic primary in Missouri | |
| Hillary Clinton | 5,434 (50.07%) |
| Barack Obama | 5,158 (47.53%) |
| John Edwards (withdrawn) | 192 (1.77%) |
| Uncommitted | {{{uncommitted}}} |
Former U.S. Senator Hillary Clinton (D-New York) received more votes, a total of 5,434, than any candidate from either party in Platte County during the 2008 presidential primary.
Communities
Cities
- Camden Point
- Dearborn
- Edgerton
- Houston Lake
- Kansas City (partly in Jackson and Clay Counties and a small part in Cass County)
- Lake Waukomis
- Northmoor
- Parkville
- Platte City (county seat)
- Platte Woods
- Riverside
- Smithville (mostly in Clay County)
- Tracy
- Weatherby Lake
- Weston
Villages
Unincorporated communities
See also
References
- "State & County QuickFacts". United States Census Bureau. Archived from the original on June 24, 2011. Retrieved September 12, 2013.
- "Find a County". National Association of Counties. Retrieved 2011-06-07.
- "Platte County History". Platte County, Missouri. Archived from the original on March 24, 2015. Retrieved November 25, 2014.
- Soil Survey (Platte County, Missouri ed.). U.S. Dept of Agriculture. 1923. p. 2. Retrieved 19 January 2015.
- "2010 Census Gazetteer Files". United States Census Bureau. August 22, 2012. Archived from the original on October 21, 2013. Retrieved November 18, 2014.
- "Population and Housing Unit Estimates". Retrieved November 13, 2019.
- "U.S. Decennial Census". United States Census Bureau. Retrieved November 18, 2014.
- "Historical Census Browser". University of Virginia Library. Retrieved November 18, 2014.
- "Population of Counties by Decennial Census: 1900 to 1990". United States Census Bureau. Retrieved November 18, 2014.
- "Census 2000 PHC-T-4. Ranking Tables for Counties: 1990 and 2000" (PDF). United States Census Bureau. Retrieved November 18, 2014.
- "U.S. Census website". United States Census Bureau. Retrieved 2008-01-31.
- Breeding, Marshall. "Mid-Continent Public Library". Libraries.org. Retrieved May 8, 2017.
- Leip, David. "Dave Leip's Atlas of U.S. Presidential Elections". uselectionatlas.org. Retrieved 2018-03-26.
External links
- Platte County Government's Website
- Platte County Sheriff's Office Website
- Digitized 1930 Plat Book of Platte County from University of Missouri Division of Special Collections, Archives, and Rare Books
Places adjacent to Platte County, Missouri | |
|---|---|
Kansas City metropolitan area's cities and counties | ||
|---|---|---|
| Central city |  | |
| Largest cities (over 100,000 in 2000) | ||
| Medium-sized cities (10,000 to 100,000 in 2000) | ||
| Smaller Cities (between 5,000 and 9,900 in 2010) | ||
| Counties | ||
Municipalities and communities of Platte County, Missouri, United States | ||
|---|---|---|
| Cities | Map of Missouri highlighting Platte County | |
| Villages | ||
| Townships | ||
| Unincorporated communities | ||
| Footnotes | ‡This populated place also has portions in an adjacent county or counties | |
| Authority control |
|
|---|