Carlisle County, Kentucky
Carlisle County is a county located in the U.S. state of Kentucky. As of the 2010 census, the population was 5,104,[1] making it the fourth-least populous county in Kentucky. Its county seat is Bardwell.[2] The county was founded in 1886 and named for John Griffin Carlisle, a Speaker of the United States House of Representatives from Kentucky.[3] It remains a prohibition or dry county.
Carlisle County | |
|---|---|
 Carlisle County Courthouse | |
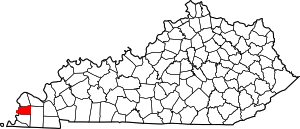 Location within the U.S. state of Kentucky | |
 Kentucky's location within the U.S. | |
| Coordinates: 36°51′N 88°59′W | |
| Country | |
| State | |
| Founded | 1886 |
| Named for | John G. Carlisle |
| Seat | Bardwell |
| Largest city | Bardwell |
| Area | |
| • Total | 199 sq mi (520 km2) |
| • Land | 189 sq mi (490 km2) |
| • Water | 9.5 sq mi (25 km2) 4.8%% |
| Population | |
| • Estimate (2018) | 4,771 |
| • Density | 27/sq mi (10/km2) |
| Time zone | UTC−6 (Central) |
| • Summer (DST) | UTC−5 (CDT) |
| Congressional district | 1st |
| Website | carlislecounty |
Geography
According to the U.S. Census Bureau, the county has a total area of 199 square miles (520 km2), of which 189 square miles (490 km2) is land and 9.5 square miles (25 km2) (4.8%) is water.[4] The county's western border with Missouri is formed by the Mississippi River.
Adjacent counties
- Ballard County (north)
- McCracken County (northeast)
- Graves County (east)
- Hickman County (south)
- Mississippi County, Missouri (west)
Demographics
| Historical population | |||
|---|---|---|---|
| Census | Pop. | %± | |
| 1890 | 7,612 | — | |
| 1900 | 10,195 | 33.9% | |
| 1910 | 9,048 | −11.3% | |
| 1920 | 8,231 | −9.0% | |
| 1930 | 7,363 | −10.5% | |
| 1940 | 7,650 | 3.9% | |
| 1950 | 6,206 | −18.9% | |
| 1960 | 5,608 | −9.6% | |
| 1970 | 5,354 | −4.5% | |
| 1980 | 5,487 | 2.5% | |
| 1990 | 5,238 | −4.5% | |
| 2000 | 5,351 | 2.2% | |
| 2010 | 5,104 | −4.6% | |
| Est. 2018 | 4,771 | [5] | −6.5% |
| U.S. Decennial Census[6] 1790-1960[7] 1900-1990[8] 1990-2000[9] 2010-2013[1] | |||
As of the census[10] of 2000, there were 5,351 people, 2,208 households, and 1,574 families residing in the county. The population density was 28 per square mile (11/km2). There were 2,490 housing units at an average density of 13 per square mile (5.0/km2). The racial makeup of the county was 97.78% White, 0.95% Black or African American, 0.41% Native American, 0.07% Asian, 0.22% from other races, and 0.56% from two or more races. 0.82% of the population were Hispanic or Latino of any race.
There were 2,208 households out of which 30.60% had children under the age of 18 living with them, 58.50% were married couples living together, 9.30% had a female householder with no husband present, and 28.70% were non-families. 26.30% of all households were made up of individuals and 13.10% had someone living alone who was 65 years of age or older. The average household size was 2.40 and the average family size was 2.88.
In the county, the population was spread out with 23.40% under the age of 18, 7.80% from 18 to 24, 26.40% from 25 to 44, 24.10% from 45 to 64, and 18.30% who were 65 years of age or older. The median age was 40 years. For every 100 females there were 95.20 males. For every 100 females age 18 and over, there were 92.90 males.
The median income for a household in the county was $30,087, and the median income for a family was $33,433. Males had a median income of $29,523 versus $19,792 for females. The per capita income for the county was $16,276. About 10.50% of families and 13.10% of the population were below the poverty line, including 17.40% of those under age 18 and 11.00% of those age 65 or over.
Politics
| Year | Republican | Democratic | Third parties |
|---|---|---|---|
| 2016 | 80.5% 2,094 | 16.6% 432 | 2.9% 75 |
| 2012 | 70.1% 1,835 | 28.6% 750 | 1.3% 34 |
| 2008 | 64.9% 1,699 | 33.6% 879 | 1.5% 39 |
| 2004 | 61.0% 1,734 | 38.7% 1,102 | 0.3% 9 |
| 2000 | 54.2% 1,405 | 44.3% 1,149 | 1.5% 39 |
| 1996 | 33.6% 816 | 55.8% 1,355 | 10.5% 256 |
| 1992 | 33.2% 844 | 54.3% 1,383 | 12.5% 318 |
| 1988 | 43.1% 1,104 | 55.7% 1,428 | 1.3% 32 |
| 1984 | 50.2% 1,308 | 49.0% 1,277 | 0.9% 23 |
| 1980 | 38.3% 975 | 60.6% 1,542 | 1.1% 28 |
| 1976 | 17.7% 435 | 80.8% 1,985 | 1.5% 36 |
| 1972 | 55.8% 1,169 | 41.6% 872 | 2.7% 56 |
| 1968 | 19.7% 479 | 46.9% 1,144 | 33.4% 815 |
| 1964 | 15.2% 282 | 84.5% 1,565 | 0.3% 6 |
| 1960 | 35.6% 978 | 64.4% 1,770 | 0.0% 0 |
| 1956 | 22.7% 608 | 77.1% 2,063 | 0.2% 5 |
| 1952 | 26.0% 656 | 74.0% 1,867 | 0.0% 1 |
| 1948 | 12.6% 279 | 85.5% 1,899 | 1.9% 42 |
| 1944 | 19.7% 505 | 80.1% 2,057 | 0.2% 6 |
| 1940 | 17.4% 500 | 82.2% 2,366 | 0.4% 12 |
| 1936 | 16.2% 420 | 82.7% 2,150 | 1.2% 30 |
| 1932 | 12.4% 402 | 87.3% 2,840 | 0.3% 11 |
| 1928 | 28.3% 787 | 71.7% 1,994 | 0.1% 2 |
| 1924 | 16.9% 467 | 81.6% 2,250 | 1.5% 41 |
| 1920 | 20.0% 688 | 78.1% 2,688 | 1.9% 66 |
| 1916 | 22.6% 494 | 75.3% 1,646 | 2.1% 45 |
| 1912 | 17.0% 331 | 72.6% 1,409 | 10.4% 202 |
Communities
Census-designated place
Other unincorporated communities
See also
References
- "State & County QuickFacts". United States Census Bureau. Retrieved March 6, 2014.
- "Find a County". National Association of Counties. Archived from the original on 2011-05-31. Retrieved 2011-06-07.
- The Register of the Kentucky State Historical Society, Volume 1. Kentucky State Historical Society. 1903. pp. 34.
- "2010 Census Gazetteer Files". United States Census Bureau. August 22, 2012. Archived from the original on August 12, 2014. Retrieved August 13, 2014.
- "Population and Housing Unit Estimates". Retrieved July 26, 2019.
- "U.S. Decennial Census". United States Census Bureau. Retrieved August 13, 2014.
- "Historical Census Browser". University of Virginia Library. Retrieved August 13, 2014.
- "Population of Counties by Decennial Census: 1900 to 1990". United States Census Bureau. Retrieved August 13, 2014.
- "Census 2000 PHC-T-4. Ranking Tables for Counties: 1990 and 2000" (PDF). United States Census Bureau. Retrieved August 13, 2014.
- "U.S. Census website". United States Census Bureau. Retrieved 2008-01-31.
- Leip, David. "Dave Leip's Atlas of U.S. Presidential Elections". uselectionatlas.org. Retrieved 2018-06-30.
Municipalities and communities of Carlisle County, Kentucky, United States | ||
|---|---|---|
| Cities | Location of Carlisle County, Kentucky | |
| Unincorporated communities | ||
| Authority control |
|
|---|