Marion County, Missouri
Marion County is a county located in the northeastern portion of Missouri. As of the 2010 census, the population was 28,781.[1] Its county seat is Palmyra.[2] Unique from most third-class counties in the state, Marion has two county courthouses, the second located in Hannibal.[3] The county was organized December 23, 1826[4][5] and named for General Francis Marion, the "Swamp Fox," who was from South Carolina and served in the American Revolutionary War.[6] The area was known as the "Two Rivers Country" before organization.
Marion County | |
|---|---|
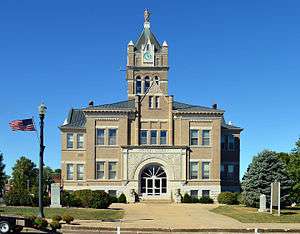 Marion County courthouse in Palmyra | |
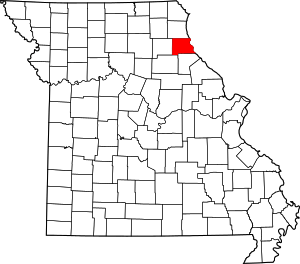 Location within the U.S. state of Missouri | |
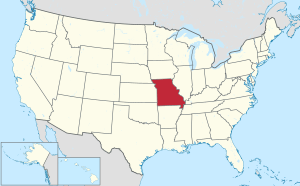 Missouri's location within the U.S. | |
| Coordinates: 39°49′N 91°37′W | |
| Country | |
| State | |
| Founded | December 23, 1826 |
| Named for | Francis Marion |
| Seat | Palmyra |
| Largest city | Hannibal |
| Area | |
| • Total | 444 sq mi (1,150 km2) |
| • Land | 437 sq mi (1,130 km2) |
| • Water | 7.4 sq mi (19 km2) 1.7% |
| Population (2010) | |
| • Total | 28,781 |
| • Estimate (2018) | 28,592 |
| • Density | 65/sq mi (25/km2) |
| Time zone | UTC−6 (Central) |
| • Summer (DST) | UTC−5 (CDT) |
| Congressional district | 6th |
| Website | http://marioncountymo.com/ |
Marion County is part of the Hannibal, Missouri Micropolitan Statistical Area, which is included in the Quincy-Hannibal, IL-MO Combined Statistical Area.
Geography
According to the U.S. Census Bureau, the county has a total area of 444 square miles (1,150 km2), of which 437 square miles (1,130 km2) is land and 7.4 square miles (19 km2) (1.7%) is water.[7]
Adjacent counties
- Lewis County (north)
- Adams County, Illinois (northeast)
- Pike County, Illinois (southeast)
- Ralls County (south)
- Monroe County (southwest)
- Shelby County (west)
Demographics
| Historical population | |||
|---|---|---|---|
| Census | Pop. | %± | |
| 1830 | 4,837 | — | |
| 1840 | 9,623 | 98.9% | |
| 1850 | 12,230 | 27.1% | |
| 1860 | 18,838 | 54.0% | |
| 1870 | 23,780 | 26.2% | |
| 1880 | 24,837 | 4.4% | |
| 1890 | 26,233 | 5.6% | |
| 1900 | 26,331 | 0.4% | |
| 1910 | 30,572 | 16.1% | |
| 1920 | 30,226 | −1.1% | |
| 1930 | 33,493 | 10.8% | |
| 1940 | 31,576 | −5.7% | |
| 1950 | 29,765 | −5.7% | |
| 1960 | 29,522 | −0.8% | |
| 1970 | 28,121 | −4.7% | |
| 1980 | 28,638 | 1.8% | |
| 1990 | 27,682 | −3.3% | |
| 2000 | 28,289 | 2.2% | |
| 2010 | 28,781 | 1.7% | |
| Est. 2018 | 28,592 | [8] | −0.7% |
| U.S. Decennial Census[9] 1790-1960[10] 1900-1990[11] 1990-2000[12] 2010-2015[1] | |||
As of the census[13] of 2010, there were 28,781 people, 11,066 households, and 7,524 families residing in the county. The population density was 65 people per square mile (25/km²). There were 12,443 housing units at an average density of 28 per square mile (11/km²). The racial makeup of the county was 93.26% White, 4.62% Black or African American, 0.27% Native American, 0.28% Asian, 0.08% Pacific Islander, 0.18% from other races, and 1.32% from two or more races. Approximately 0.89% of the population were Hispanic or Latino of any race. 28.5% were of German, 25.6% American, 11.0% Irish and 10.3% English ancestry.
There were 11,066 households out of which 33.30% had children under the age of 18 living with them, 53.50% were married couples living together, 11.40% had a female householder with no husband present, and 32.00% were non-families. 28.10% of all households were made up of individuals and 13.80% had someone living alone who was 65 years of age or older. The average household size was 2.44 and the average family size was 2.98.
In the county, the population was spread out with 25.70% under the age of 18, 9.50% from 18 to 24, 26.40% from 25 to 44, 21.70% from 45 to 64, and 16.60% who were 65 years of age or older. The median age was 37 years. For every 100 females, there were 89.40 males. For every 100 females age 18 and over, there were 85.70 males.
The median income for a household in the county was $31,774, and the median income for a family was $41,290. Males had a median income of $30,935 versus $20,591 for females. The per capita income for the county was $16,964. About 9.30% of families and 12.10% of the population were below the poverty line, including 15.30% of those under age 18 and 10.50% of those age 65 or over.
Education
Public schools
- Hannibal Public School District No. 60 – Hannibal
- Veterans Elementary School (PK-05)
- A.D. Stowell Elementary School (PK-05)
- Mark Twain Elementary School (PK-05)
- Oakwood Elementary School (PK-05)
- Eugene Field Elementary School (PK-05)
- Hannibal Middle School (06-08)
- Hannibal High School (09-12)
- Palmyra R-I School District – Palmyra
- Palmyra Elementary School (K-04)
- Palmyra Middle School (05-08)
- Palmyra High School (09-12)
- Marion County R-II School District – Philadelphia
- Marion County Elementary School (K-06)
- Marion County High School (07-12)
Private schools
- Holy Family Catholic School – Hannibal (K-09) – Roman Catholic
- St. John’s Lutheran School – Hannibal (K-06) – Lutheran
Post-secondary
- Hannibal–LaGrange University – Hannibal – A private, four-year Southern Baptist university.
Politics
| Marion County, Missouri | ||||
|---|---|---|---|---|
| Elected countywide officials | ||||
| Assessor | Mark Novak | Democratic | ||
| Circuit Clerk | Valerie Munzlinger (Division I) / Carolyn Conners (Division II) | Democratic | ||
| County Clerk | Valerie Dornberger | Democratic | ||
| Collector | Mary Ann Viorel | Democratic | ||
| Commissioner (Presiding) |
Lyndon Bode | Democratic | ||
| Commissioner (District 1) |
Robert Heiser | Democratic | ||
| Commissioner (District 2) |
Randy Spratt | Republican | ||
| Coroner | Darrell McCoy | Democratic | ||
| Prosecuting Attorney | Thomas P. Redington | Democratic | ||
| Public Administrator | Wendy Howe | Democratic | ||
| Recorder | Janet Dearing | Democratic | ||
| Sheriff | Jimmy Shinn | Democratic | ||
| Surveyor | John D. Janes | Independent | ||
| Treasurer | Joelle Fohey | Democratic | ||
State
| Year | Republican | Democratic | Third Parties |
|---|---|---|---|
| 2016 | 65.84% 8,484 | 31.86% 4,105 | 2.30% 297 |
| 2012 | 53.03% 6,380 | 44.83% 5,394 | 2.14% 257 |
| 2008 | 58.82% 7,341 | 39.77% 4,964 | 1.41% 176 |
| 2004 | 67.03% 8,292 | 31.77% 3,930 | 1.20% 148 |
| 2000 | 50.05% 5,832 | 48.88% 5,696 | 1.07% 125 |
| 1996 | 31.55% 3,388 | 66.68% 7,161 | 1.78% 191 |
Marion County is in Missouri's 5th district in the Missouri House of Representatives, represented by Lindell F. Shumake (R-Hannibal).
| Party | Candidate | Votes | % | ± | |
|---|---|---|---|---|---|
| Republican | Lindell F. Shumake | 9,532 | 74.88% | +0.24 | |
| Democratic | O.C. Latta | 3,197 | 25.12% | -0.24 | |
| Party | Candidate | Votes | % | ± | |
|---|---|---|---|---|---|
| Republican | Lindell F. Shumake | 5,089 | 74.64% | +12.30 | |
| Democratic | C. Leroy Deichman | 1,729 | 25.36% | -12.30 | |
| Party | Candidate | Votes | % | ± | |
|---|---|---|---|---|---|
| Republican | Lindell F. Shumake | 7,445 | 62.34% | ||
| Democratic | Tom Shively | 4,497 | 37.66% | ||
All of Marion County is a part of Missouri’s 18th District in the Missouri Senate; it is represented by Brian Munzlinger (R-Williamstown).
| Party | Candidate | Votes | % | ± | |
|---|---|---|---|---|---|
| Republican | Brian Munzlinger | 5,630 | 100.00% | ||
Federal
| Party | Candidate | Votes | % | ± | |
|---|---|---|---|---|---|
| Republican | Roy Blunt | 8,239 | 64.11% | +11.46 | |
| Democratic | Jason Kander | 4,115 | 32.02% | -11.77 | |
| Libertarian | Jonathan Dine | 277 | 2.16% | -1.40 | |
| Green | Johnathan McFarland | 128 | 1.00% | +1.00 | |
| Constitution | Fred Ryman | 93 | 0.72% | +0.72 | |
| Party | Candidate | Votes | % | ± | |
|---|---|---|---|---|---|
| Republican | Todd Akin | 6,350 | 52.65% | ||
| Democratic | Claire McCaskill | 5,281 | 43.79% | ||
| Libertarian | Jonathan Dine | 429 | 3.56% | ||
Marion County is included in Missouri’s 6th Congressional District and is represented by Sam Graves (R-Tarkio) in the U.S. House of Representatives.
| Party | Candidate | Votes | % | ± | |
|---|---|---|---|---|---|
| Republican | Sam Graves | 9,405 | 74.46% | +0.30 | |
| Democratic | David M. Blackwell | 2,915 | 23.08% | -0.76 | |
| Libertarian | Russ Lee Monchil | 193 | 1.53% | -0.47 | |
| Green | Mike Diel | 118 | 0.93% | +0.93 | |
| Party | Candidate | Votes | % | ± | |
|---|---|---|---|---|---|
| Republican | Sam Graves | 5,008 | 74.16% | +9.76 | |
| Democratic | Bill Hedge | 1,610 | 23.84% | -9.88 | |
| Libertarian | Russ Lee Monchil | 135 | 2.00% | +0.12 | |
| Party | Candidate | Votes | % | ± | |
|---|---|---|---|---|---|
| Republican | Sam Graves | 7,462 | 64.40% | ||
| Democratic | Kyle Yarber | 3,907 | 33.72% | ||
| Libertarian | Russ Lee Monchil | 218 | 1.88% | ||
| Year | Republican | Democratic | Third parties |
|---|---|---|---|
| 2016 | 72.8% 9,419 | 23.1% 2,994 | 4.1% 525 |
| 2012 | 65.2% 7,923 | 33.2% 4,031 | 1.7% 204 |
| 2008 | 61.4% 7,705 | 37.5% 4,703 | 1.2% 145 |
| 2004 | 62.8% 7,815 | 36.7% 4,568 | 0.6% 70 |
| 2000 | 55.9% 6,550 | 42.6% 4,993 | 1.4% 169 |
| 1996 | 43.4% 4,653 | 45.9% 4,924 | 10.7% 1,144 |
| 1992 | 40.4% 4,762 | 43.8% 5,156 | 15.8% 1,865 |
| 1988 | 47.2% 5,034 | 52.6% 5,617 | 0.2% 23 |
| 1984 | 59.4% 6,831 | 40.6% 4,666 | |
| 1980 | 49.5% 6,036 | 48.3% 5,890 | 2.1% 260 |
| 1976 | 47.2% 5,501 | 52.5% 6,124 | 0.3% 38 |
| 1972 | 63.3% 7,197 | 36.7% 4,171 | |
| 1968 | 41.6% 4,732 | 47.6% 5,416 | 10.7% 1,221 |
| 1964 | 30.3% 3,605 | 69.8% 8,314 | |
| 1960 | 48.8% 6,431 | 51.2% 6,758 | |
| 1956 | 45.1% 5,657 | 54.9% 6,874 | |
| 1952 | 42.1% 6,162 | 57.8% 8,457 | 0.1% 18 |
| 1948 | 29.4% 3,802 | 70.5% 9,122 | 0.2% 20 |
| 1944 | 34.7% 4,560 | 65.2% 8,575 | 0.1% 14 |
| 1940 | 37.6% 5,892 | 62.1% 9,723 | 0.3% 45 |
| 1936 | 29.4% 4,628 | 70.3% 11,068 | 0.3% 51 |
| 1932 | 28.4% 4,123 | 70.9% 10,293 | 0.7% 103 |
| 1928 | 57.3% 7,664 | 42.5% 5,679 | 0.2% 24 |
| 1924 | 44.0% 5,408 | 46.7% 5,739 | 9.4% 1,150 |
| 1920 | 40.4% 4,660 | 58.2% 6,719 | 1.4% 166 |
| 1916 | 37.3% 2,759 | 61.3% 4,534 | 1.5% 108 |
| 1912 | 28.7% 1,693 | 58.7% 3,471 | 12.6% 745 |
| 1908 | 37.7% 2,554 | 58.8% 3,982 | 3.5% 236 |
| 1904 | 42.2% 2,433 | 54.3% 3,127 | 3.5% 202 |
| 1900 | 38.2% 2,490 | 60.2% 3,927 | 1.7% 109 |
| 1896 | 39.9% 2,699 | 59.3% 4,008 | 0.8% 52 |
| 1892 | 36.5% 2,154 | 61.5% 3,634 | 2.0% 119 |
| 1888 | 39.0% 2,294 | 57.2% 3,365 | 3.7% 220 |
Missouri presidential preference primary (2008)
- Former U.S. Senator Hillary Clinton (D-New York) received more votes, a total of 1,587, than any candidate from either party in Marion County during the 2008 presidential primary.
| Marion County, Missouri | |
|---|---|
| 2008 Democratic primary in Missouri | |
| Hillary Clinton | 1,587 (54.44%) |
| Barack Obama | 1,188 (40.75%) |
| John Edwards (withdrawn) | 105 (3.60%) |
| Uncommitted | 18 (0.62%) |
| Marion County, Missouri | |
|---|---|
| 2008 Republican primary in Missouri | |
| John McCain | 714 (26.71%) |
| Mike Huckabee | 904 (33.82%) |
| Mitt Romney | 891 (33.33%) |
| Ron Paul | 114 (4.26%) |
Communities
- Ely
- Hannibal
- Monroe City (mostly in Monroe County and a small part in Ralls County)
- Palmyra (county seat)
- Philadelphia
- Taylor
- West Quincy
References
- "State & County QuickFacts". United States Census Bureau. Archived from the original on June 7, 2011. Retrieved September 10, 2013.
- "Find a County". National Association of Counties. Retrieved 2011-06-07.
- "Marion County, Missouri". 2013. Retrieved 2014-10-23.
- "Marion County Collection Descriptions". The State Historical Society of Missouri. Retrieved November 24, 2014.
- "A Short History of Marion County". MOGenWeb. Retrieved November 24, 2014.
- Eaton, David Wolfe (1916). How Missouri Counties, Towns and Streams Were Named. The State Historical Society of Missouri. pp. 193.
- "2010 Census Gazetteer Files". United States Census Bureau. August 22, 2012. Archived from the original on October 21, 2013. Retrieved November 16, 2014.
- "Population and Housing Unit Estimates". Retrieved November 15, 2019.
- "U.S. Decennial Census". United States Census Bureau. Retrieved November 16, 2014.
- "Historical Census Browser". University of Virginia Library. Retrieved November 16, 2014.
- "Population of Counties by Decennial Census: 1900 to 1990". United States Census Bureau. Retrieved November 16, 2014.
- "Census 2000 PHC-T-4. Ranking Tables for Counties: 1990 and 2000" (PDF). United States Census Bureau. Retrieved November 16, 2014.
- "U.S. Census website". United States Census Bureau. Retrieved 2008-01-31.
- Breeding, Marshall. "Hannibal Free Public Library". Libraries.org. Retrieved May 8, 2017.
- Breeding, Marshall. "Palmyra Bicentennial Public Library". Libraries.org. Retrieved May 8, 2017.
- Leip, David. "Dave Leip's Atlas of U.S. Presidential Elections". uselectionatlas.org. Retrieved 2018-03-25.
Further reading
- History of Marion County, Missouri: written and compiled from the most authentic official and private sources (1884) full text
External links
- Digitized 1930 Plat Book of Marion County from University of Missouri Division of Special Collections, Archives, and Rare Books
Places adjacent to Marion County, Missouri | ||||||||||
|---|---|---|---|---|---|---|---|---|---|---|
| ||||||||||
Municipalities and communities of Marion County, Missouri, United States | ||
|---|---|---|
| Cities | Map of Missouri highlighting Marion County | |
| Townships | ||
| Unincorporated communities | ||
| Ghost towns | ||
| Footnotes | ‡This populated place also has portions in an adjacent county or counties | |
| Authority control |
|
|---|