Lawrence County, Missouri
Lawrence County is a county located in the southwest portion of the U.S. state of Missouri, in the area of the Ozarks. As of the 2010 census, the population was 38,634.[1] Its county seat is Mount Vernon.[2] The county was organized in 1845 and named for James Lawrence, a naval officer from the War of 1812 known for his battle cry, "Don't give up the ship!"[3]
Lawrence County | |
|---|---|
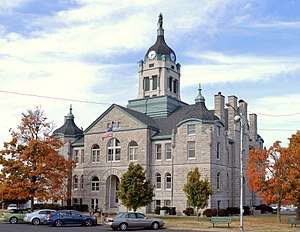 Lawrence County Courthouse in Mt. Vernon | |
 Location within the U.S. state of Missouri | |
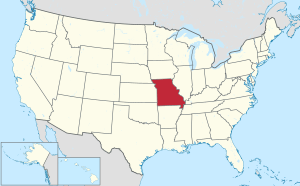 Missouri's location within the U.S. | |
| Coordinates: 37°07′N 93°50′W | |
| Country | |
| State | |
| Founded | February 14, 1845 |
| Named for | James Lawrence |
| Seat | Mount Vernon |
| Largest city | Monett |
| Area | |
| • Total | 613 sq mi (1,590 km2) |
| • Land | 612 sq mi (1,590 km2) |
| • Water | 1.6 sq mi (4 km2) 0.3% |
| Population (2010) | |
| • Total | 38,634 |
| • Estimate (2018) | 38,359 |
| • Density | 63/sq mi (24/km2) |
| Time zone | UTC−6 (Central) |
| • Summer (DST) | UTC−5 (CDT) |
| Congressional district | 7th |
| Website | www |
A previous Lawrence County, established in 1815 with its county seat at what is now Davidsonville Historic State Park in Arkansas, covered much of what is now southern Missouri and the northern third of Arkansas. When the Arkansas Territory was created from Missouri Territory in 1819, some of that earlier county became organized as Lawrence County, Arkansas.[4]
Just before that, in 1818, Missouri divided its part of the old Lawrence County into Wayne County and Madison County; with population increases, those counties were later divided into others, including the present Lawrence County.
History
Following the Reconstruction era, southwestern Missouri became increasingly hostile to African Americans, and whites attacked blacks in Lawrence and other counties, seeking to expel them from the region. An African-American man was lynched in Verona, Missouri on January 26, 1894; his name was not recorded.[5] On August 19, 1901, three men were lynched by a white mob in the county seat, Pierce City, in Lawrence County. The mob also burned down some black homes, and drove roughly 30 families, a total of 300 African Americans, out of the city altogether. Whites took over their properties and the African Americans were never compensated for losses.[6]
As a result of such incidents, many African Americans left Southwest Missouri in the early 20th century.[7][8] The extrajudicial murders were part of a pattern of discrimination, repeated violence and intimidation of African Americans in southwest Missouri from 1894 to 1909.[7] Whites in Greene conducted a mass lynching of three African-Americans in 1906 in the courthouse square.[7][8]
Geography
According to the U.S. Census Bureau, the county has a total area of 613 square miles (1,590 km2), of which 612 square miles (1,590 km2) is land and 1.6 square miles (4.1 km2) (0.3%) is water.[9]
Adjacent counties
- Dade County (north)
- Greene County (northeast)
- Christian County (southeast)
- Stone County (southeast)
- Barry County (south)
- Newton County (southwest)
- Jasper County (west)
National protected area
Demographics
| Historical population | |||
|---|---|---|---|
| Census | Pop. | %± | |
| 1850 | 4,859 | — | |
| 1860 | 8,840 | 81.9% | |
| 1870 | 12,977 | 46.8% | |
| 1880 | 17,583 | 35.5% | |
| 1890 | 26,228 | 49.2% | |
| 1900 | 31,662 | 20.7% | |
| 1910 | 26,583 | −16.0% | |
| 1920 | 24,211 | −8.9% | |
| 1930 | 23,774 | −1.8% | |
| 1940 | 24,637 | 3.6% | |
| 1950 | 23,420 | −4.9% | |
| 1960 | 23,260 | −0.7% | |
| 1970 | 24,585 | 5.7% | |
| 1980 | 28,973 | 17.8% | |
| 1990 | 30,236 | 4.4% | |
| 2000 | 35,204 | 16.4% | |
| 2010 | 38,634 | 9.7% | |
| Est. 2018 | 38,359 | [10] | −0.7% |
| U.S. Decennial Census[11] 1790-1960[12] 1900-1990[13] 1990-2000[14] 2010-2015[1] | |||
As of the census[15] of 2000, there were 35,204 people, 13,568 households, and 9,728 families residing in the county. The population density was 57 people per square mile (22/km²). There were 14,789 housing units at an average density of 24 per square mile (9/km²). The racial makeup of the county was 95.68% White, 0.27% Black or African American, 0.76% Native American, 0.22% Asian, 0.02% Pacific Islander, 1.67% from other races, and 1.37% from two or more races. Approximately 3.39% of the population were Hispanic or Latino of any race.
There were 13,568 households out of which 33.60% had children under the age of 18 living with them, 58.90% were married couples living together, 9.00% had a female householder with no husband present, and 28.30% were non-families. 24.50% of all households were made up of individuals and 11.90% had someone living alone who was 65 years of age or older. The average household size was 2.55 and the average family size was 3.03.
In the county, the population was spread out with 27.20% under the age of 18, 7.90% from 18 to 24, 26.90% from 25 to 44, 22.40% from 45 to 64, and 15.60% who were 65 years of age or older. The median age was 37 years. For every 100 females there were 97.00 males. For every 100 females age 18 and over, there were 92.10 males.
The median income for a household in the county was $31,239, and the median income for a family was $36,846. Males had a median income of $27,309 versus $18,990 for females. The per capita income for the county was $15,399. About 11.00% of families and 14.10% of the population were below the poverty line, including 19.50% of those under age 18 and 11.80% of those age 65 or over.
Education
Public schools
- Aurora R-VIII School District – Aurora
- Pate Early Childhood Center (PK-02)
- Robinson Elementary School (03-04)
- Robinson Intermediate School (05-06)
- Aurora Junior High School (07-08)
- Aurora High School (09-12)
- Marionville R-IX School District – Marionville
- Marionville Elementary School (PK-05)
- Marionville Middle School (06-08)
- Marionville High School (09-12)
- Miller R-II School District – Miller
- Central Elementary School (K-06)
- Miller High School (07-12)
- Mt. Vernon R-V School District – Mt. Vernon
- Mt. Vernon Elementary School (PK-02)
- Mt. Vernon Intermediate School (03-05)
- Mt. Vernon Middle School (06-08)
- Mt. Vernon High School (09-12)
- Pierce City R-VI School District – Pierce City
- Central Elementary School (PK-05)
- Pierce City Middle School (06-08)
- Pierce City High School (09-12)
- Verona R-VII School District – Verona
- Verona Elementary School (PK-06)
- Verona High School (07-12)
Private schools
- Aurora Christian Academy – Aurora (K-12) – Baptist (Special Education Emphasis)
- Harvest Christian Academy – Aurora (K-12) – Nondenominational Christian
- Round Grove Christian Academy – Miller (PK-09) – Baptist
- Trinity Lutheran School – Freistatt (PK-08) – Lutheran
- St. Mary’s Catholic School – Pierce City (PK-08) – Roman Catholic
Public libraries
- Barry-Lawrence Regional Library[16]
Politics
Local
The Republican Party completely controls politics at the local level in Lawrence County. Republicans hold all elected positions in the county.
| Lawrence County, Missouri | ||||
|---|---|---|---|---|
| Elected countywide officials | ||||
| Assessor | Doug Bowerman | Republican | ||
| Circuit Clerk | Steven W. Kahre | Republican | ||
| County Clerk | Gary Emerson | Republican | ||
| Collector | Kelli McVey | Republican | ||
| Commissioner (Presiding) |
Sam Goodman | Republican | ||
| Commissioner (District 1) |
Joe Ruscha | Republican | ||
| Commissioner (District 2) |
Rodney Barnes | Republican | ||
| Coroner | Scott Lakin | Republican | ||
| Prosecuting Attorney | Don Trotter | Republican | ||
| Public Administrator | Pam Fobair | Republican | ||
| Recorder | Pam Robertson | Republican | ||
| Sheriff | Brad DeLay | Republican | ||
| Surveyor | Aaron Austin | Republican | ||
| Treasurer | Kathy Fairchild | Republican | ||
State
| Year | Republican | Democratic | Third Parties |
|---|---|---|---|
| 2016 | 69.34% 11,565 | 26.87% 4,482 | 3.79% 632 |
| 2012 | 57.51% 9,022 | 39.91% 6,261 | 2.58% 405 |
| 2008 | 49.15% 8,118 | 47.94% 7,918 | 2.91% 482 |
| 2004 | 70.22% 11,069 | 28.55% 4,500 | 1.23% 194 |
| 2000 | 58.24% 7,447 | 39.93% 5,106 | 1.82% 233 |
| 1996 | 54.20% 6,695 | 42.13% 5,204 | 3.68% 454 |
Lawrence County is divided into two legislative districts in the Missouri House of Representatives, both of which are held by Republicans.
| Party | Candidate | Votes | % | ± | |
|---|---|---|---|---|---|
| Republican | Mike Moon | 11,632 | 74.17% | -1.94 | |
| Independent | Stephanie Davis | 4,050 | 25.83% | +25.83 | |
| Party | Candidate | Votes | % | ± | |
|---|---|---|---|---|---|
| Republican | Mike Moon | 6,407 | 76.11% | -23.89 | |
| Democratic | Vince Jennings | 2,011 | 23.89% | +23.89 | |
| Party | Candidate | Votes | % | ± | |
|---|---|---|---|---|---|
| Republican | Don Ruzicka | 13,426 | 100.00% | ||
- District 158 — Scott Fitzpatrick (R-Shell Knob). Consists of a part of the southwest corner of the county, including about half of Pierce City.
| Party | Candidate | Votes | % | ± | |
|---|---|---|---|---|---|
| Republican | Scott Fitzpatrick | 434 | 100.00% | ||
| Party | Candidate | Votes | % | ± | |
|---|---|---|---|---|---|
| Republican | Scott Fitzpatrick | 246 | 100.00% | +16.55 | |
| Party | Candidate | Votes | % | ± | |
|---|---|---|---|---|---|
| Republican | Scott Fitzpatrick | 373 | 83.45% | ||
| Constitution | Sue Beck | 74 | 16.55% | ||
All of Lawrence County is a part of Missouri’s 29th District in the Missouri Senate and is currently represented by David Sater (R-Cassville.
| Party | Candidate | Votes | % | ± | |
|---|---|---|---|---|---|
| Republican | David Sater | 14,298 | 100.00% | ||
| Party | Candidate | Votes | % | ± | |
|---|---|---|---|---|---|
| Republican | David Sater | 13,580 | 100.00% | ||
Federal
| Party | Candidate | Votes | % | ± | |
|---|---|---|---|---|---|
| Republican | Roy Blunt | 11,525 | 69.04% | +14.46 | |
| Democratic | Jason Kander | 4,336 | 25.98% | -11.41 | |
| Libertarian | Jonathan Dine | 440 | 2.64% | -5.39 | |
| Green | Johnathan McFarland | 192 | 1.15% | +1.15 | |
| Constitution | Fred Ryman | 199 | 1.19% | +1.19 | |
| Party | Candidate | Votes | % | ± | |
|---|---|---|---|---|---|
| Republican | Todd Akin | 8,510 | 54.58% | ||
| Democratic | Claire McCaskill | 5,830 | 37.39% | ||
| Libertarian | Jonathan Dine | 1,252 | 8.03% | ||
All of Lawrence County is included in Missouri's 7th Congressional District and is currently represented by Billy Long (R-Springfield) in the U.S. House of Representatives.
| Party | Candidate | Votes | % | ± | |
|---|---|---|---|---|---|
| Republican | Billy Long | 11,622 | 70.77% | +12.23 | |
| Democratic | Genevieve Williams | 3,813 | 23.22% | -6.55 | |
| Libertarian | Benjamin T. Brixey | 987 | 6.01% | -5.68 | |
| Party | Candidate | Votes | % | ± | |
|---|---|---|---|---|---|
| Republican | Billy Long | 5,078 | 58.54% | -6.22 | |
| Democratic | Jim Evans | 2,583 | 29.77% | +1.17 | |
| Libertarian | Kevin Craig | 1,014 | 11.69% | +5.05 | |
| Party | Candidate | Votes | % | ± | |
|---|---|---|---|---|---|
| Republican | Billy Long | 9,956 | 64.76% | ||
| Democratic | Jim Evans | 4,397 | 28.60% | ||
| Libertarian | Kevin Craig | 1,020 | 6.64% | ||
Political culture
| Year | Republican | Democratic | Third parties |
|---|---|---|---|
| 2016 | 77.9% 13,089 | 17.3% 2,901 | 4.9% 821 |
| 2012 | 72.5% 11,421 | 25.5% 4,017 | 2.0% 317 |
| 2008 | 67.5% 11,263 | 30.6% 5,097 | 2.0% 325 |
| 2004 | 70.8% 11,194 | 28.5% 4,506 | 0.7% 106 |
| 2000 | 64.4% 8,305 | 32.8% 4,235 | 2.8% 363 |
| 1996 | 49.5% 6,099 | 36.2% 4,465 | 14.3% 1,768 |
| 1992 | 43.5% 5,608 | 36.2% 4,666 | 20.3% 2,617 |
| 1988 | 60.7% 6,911 | 39.0% 4,432 | 0.3% 36 |
| 1984 | 69.2% 8,370 | 30.8% 3,720 | |
| 1980 | 61.7% 7,921 | 36.4% 4,670 | 2.0% 252 |
| 1976 | 51.9% 5,784 | 47.7% 5,315 | 0.3% 38 |
| 1972 | 73.0% 8,445 | 27.0% 3,130 | |
| 1968 | 59.7% 6,834 | 32.4% 3,710 | 7.9% 898 |
| 1964 | 48.7% 6,047 | 51.4% 6,383 | |
| 1960 | 65.2% 8,406 | 34.8% 4,483 | |
| 1956 | 60.6% 7,372 | 39.4% 4,789 | |
| 1952 | 65.3% 8,029 | 34.4% 4,232 | 0.3% 34 |
| 1948 | 53.6% 5,392 | 46.2% 4,649 | 0.2% 17 |
| 1944 | 63.8% 6,836 | 36.0% 3,859 | 0.3% 27 |
| 1940 | 57.9% 7,317 | 41.8% 5,279 | 0.4% 45 |
| 1936 | 49.7% 6,185 | 49.7% 6,184 | 0.6% 70 |
| 1932 | 38.6% 4,146 | 59.7% 6,411 | 1.6% 175 |
| 1928 | 63.2% 6,328 | 36.4% 3,646 | 0.4% 43 |
| 1924 | 49.4% 4,499 | 41.3% 3,768 | 9.3% 849 |
| 1920 | 61.3% 6,093 | 35.6% 3,532 | 3.1% 310 |
| 1916 | 50.8% 3,228 | 44.2% 2,809 | 4.9% 313 |
| 1912 | 23.4% 1,312 | 42.5% 2,384 | 34.2% 1,920 |
| 1908 | 50.9% 3,028 | 42.5% 2,532 | 6.6% 392 |
| 1904 | 52.6% 3,077 | 40.5% 2,372 | 6.9% 406 |
| 1900 | 50.4% 3,552 | 47.1% 3,313 | 2.5% 177 |
| 1896 | 46.5% 2,962 | 52.9% 3,369 | 0.7% 44 |
| 1892 | 44.4% 2,623 | 41.1% 2,428 | 14.4% 851 |
| 1888 | 47.5% 2,460 | 42.1% 2,181 | 10.5% 542 |
Missouri presidential preference primary (2008)
Voters in Lawrence County from both political parties supported candidates who finished in second place in the state at large and nationally.
- Former Governor Mike Huckabee (R-Arkansas) received more votes, a total of 2,628, than any candidate from either party in Lawrence County during the 2008 presidential primary.
| Lawrence County, Missouri | |
|---|---|
| 2008 Republican primary in Missouri | |
| John McCain | 1,412 (26.19%) |
| Mike Huckabee | 2,628 (48.75%) |
| Mitt Romney | 1,022 (18.96%) |
| Ron Paul | 232 (4.30%) |
| Lawrence County, Missouri | |
|---|---|
| 2008 Democratic primary in Missouri | |
| Hillary Clinton | 2,040 (61.58%) |
| Barack Obama | 1,155 (34.86%) |
| John Edwards (withdrawn) | 93 (2.81%) |
Communities
Cities
- Aurora
- Marionville
- Miller
- Monett
- Mount Vernon (county seat)
- Pierce City
- Stotts City
- Verona
Census-designated place
Other unincorporated places
See also
- List of counties in Missouri
- National Register of Historic Places listings in Lawrence County, Missouri
References
- "State & County QuickFacts". United States Census Bureau. Archived from the original on June 7, 2011. Retrieved September 10, 2013.
- "Find a County". National Association of Counties. Retrieved 2011-06-07.
- Eaton, David Wolfe (1916). How Missouri Counties, Towns and Streams Were Named. The State Historical Society of Missouri. pp. 184.
- "1815 city got off to fine start". Arkansas Democrat-Gazette (behind paywall). 1 November 2015. Retrieved 2 November 2015.
- "Lynching in Missouri", Saline County, Missouri/MOGenWeb Project, 1996-2018; accessed 12 April 2018
- "Pierce City: August 19th, 1901". oaahm.omeka.net. Ozarks Afro-American History Museum Online. Retrieved 2016-10-31.
- Kimberly Harper, White Man's Heaven: The Lynching and Expulsion of Blacks in the Southern Ozarks, 1894-1909, University of Arkansas Press, 2012
- Lynching in America/ Supplement: Lynchings by County, 3rd edition Archived 2017-10-23 at the Wayback Machine, Montgomery, Alabama: Equal Justice Initiative, 2015, p. 7
- "2010 Census Gazetteer Files". United States Census Bureau. August 22, 2012. Archived from the original on September 13, 2014. Retrieved November 16, 2014.
- "Population and Housing Unit Estimates". Retrieved November 18, 2019.
- "U.S. Decennial Census". United States Census Bureau. Retrieved November 16, 2014.
- "Historical Census Browser". University of Virginia Library. Retrieved November 16, 2014.
- "Population of Counties by Decennial Census: 1900 to 1990". United States Census Bureau. Retrieved November 16, 2014.
- "Census 2000 PHC-T-4. Ranking Tables for Counties: 1990 and 2000" (PDF). United States Census Bureau. Retrieved November 16, 2014.
- "U.S. Census website". United States Census Bureau. Retrieved 2008-01-31.
- Breeding, Marshall. "Barry-Lawrence Regional Library". Libraries.org. Retrieved May 8, 2017.
- Leip, David. "Dave Leip's Atlas of U.S. Presidential Elections". uselectionatlas.org. Retrieved 2018-03-25.
External links
- Digitized 1930 Plat Book of Lawrence County from University of Missouri Division of Special Collections, Archives, and Rare Books
- https://www.webcitation.org/609AsaFfq?url=http://quickfacts.census.gov/qfd/states/29/29109.html
Places adjacent to Lawrence County, Missouri | ||||||||||
|---|---|---|---|---|---|---|---|---|---|---|
| ||||||||||
Municipalities and communities of Lawrence County, Missouri, United States | ||
|---|---|---|
| Cities | Map of Missouri highlighting Lawrence County | |
| Villages | ||
| Townships | ||
| Other unincorporated communities | ||
| Ghost town | ||
| Footnotes | ‡This populated place also has portions in an adjacent county or counties | |
| Authority control |
|
|---|