Linn County, Missouri
Linn County is a county located in the northern portion of the U.S. state of Missouri. As of the 2010 census, the population was 12,761.[1] Its county seat is Linneus.[2] The county was organized January 1, 1837 and named after U.S. Senator Lewis F. Linn of Missouri.[3]
Linn County | |
|---|---|
 Linn County Courthouse in Linneus | |
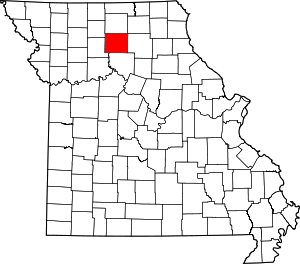 Location within the U.S. state of Missouri | |
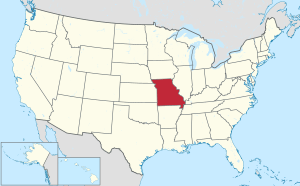 Missouri's location within the U.S. | |
| Coordinates: 39°52′N 93°07′W | |
| Country | |
| State | |
| Founded | January 1, 1837 |
| Named for | Lewis F. Linn |
| Seat | Linneus |
| Largest city | Brookfield |
| Area | |
| • Total | 621 sq mi (1,610 km2) |
| • Land | 616 sq mi (1,600 km2) |
| • Water | 5.8 sq mi (15 km2) 0.9% |
| Population (2010) | |
| • Total | 12,761 |
| • Estimate (2018) | 12,037 |
| • Density | 21/sq mi (7.9/km2) |
| Time zone | UTC−6 (Central) |
| • Summer (DST) | UTC−5 (CDT) |
| Congressional district | 6th |
Geography
According to the U.S. Census Bureau, the county has a total area of 621 square miles (1,610 km2), of which 616 square miles (1,600 km2) is land and 5.8 square miles (15 km2) (0.9%) is water.[4]
Adjacent counties
- Sullivan County (north)
- Adair County (northeast)
- Macon County (east)
- Chariton County (south)
- Livingston County (west)
- Grundy County (northwest)
Demographics
| Historical population | |||
|---|---|---|---|
| Census | Pop. | %± | |
| 1840 | 2,245 | — | |
| 1850 | 4,058 | 80.8% | |
| 1860 | 9,112 | 124.5% | |
| 1870 | 15,900 | 74.5% | |
| 1880 | 20,016 | 25.9% | |
| 1890 | 24,141 | 20.6% | |
| 1900 | 25,503 | 5.6% | |
| 1910 | 25,253 | −1.0% | |
| 1920 | 24,778 | −1.9% | |
| 1930 | 23,339 | −5.8% | |
| 1940 | 21,416 | −8.2% | |
| 1950 | 18,865 | −11.9% | |
| 1960 | 16,815 | −10.9% | |
| 1970 | 15,125 | −10.1% | |
| 1980 | 15,495 | 2.4% | |
| 1990 | 13,885 | −10.4% | |
| 2000 | 13,754 | −0.9% | |
| 2010 | 12,761 | −7.2% | |
| Est. 2018 | 12,037 | [5] | −5.7% |
| U.S. Decennial Census[6] 1790-1960[7] 1900-1990[8] 1990-2000[9] 2010-2015[1] | |||
As of the census[10] of 2000, there were 13,754 people, 5,697 households and 3,760 families residing in the county. The population density was 22 people per square mile (9/km²). There were 6,554 housing units at an average density of 11 per square mile (4/km²). The racial makeup of the county was 97.98% White, 0.60% Black or African American, 0.38% Native American, 0.14% Asian, 0.15% from other races and 0.76% from two or more races. Approximately 0.76% of the population were Hispanic or Latino of any race.
There were 5,697 households, out of which 29.60% had children under the age of 18 living with them, 53.60% were married couples living together, 8.90% had a female householder with no husband present and 34.00% were non-families. 30.30% of all households were made up of individuals and 16.80% had someone living alone who was 65 years of age or older. The average household size was 2.37 and the average family size was 2.94.
In the county, the population was spread out with 25.40% under the age of 18, 7.00% from 18 to 24, 24.40% from 25 to 44, 22.60% from 45 to 64 and 20.60% who were 65 years of age or older. The median age was 40 years. For every 100 females there were 89.60 males. For every 100 females age 18 and over, there were 85.70 males.
The median income for a household in the county was $28,242, and the median income for a family was $36,134. Males had a median income of $25,635 versus $18,820 for females. The per capita income for the county was $15,378. About 11.30% of families and 14.90% of the population were below the poverty line, including 20.20% of those under age 18 and 14.10% of those age 65 or over.
Education
Public schools
- Brookfield R-III School District – Brookfield
- Brookfield Elementary School (PK-04)
- Brookfield Middle School (05-08)
- Brookfield High School (09-12)
- Bucklin R-II School District – Bucklin
- Bucklin Elementary School (PK-06)
- Bucklin High School (07-12)
- Linn County R-1 School District – Purdin
- Linn County Elementary School (PK-05)
- Linn County High School (06-12)
- Marceline R-V School District – Marceline
- Walt Disney Elementary School (K-05)
- Marceline Middle School (06-08)
- Marceline High School (09-12)
- Meadville R-IV School District – Meadville
- Meadville Elementary School (K-06)
- Meadville High School (07-12)
Private schools
- Father McCartan Memorial School – Marceline (K-09) – Roman Catholic
- Locust Creek Mennonite School – Laclede (02-09) – Mennonite
Politics
Local
| Linn County, Missouri | ||||
|---|---|---|---|---|
| Elected countywide officials | ||||
| Assessor | Marlene Graves | Democratic | ||
| Circuit Clerk | Mary S. Enyeart | Democratic | ||
| County Clerk | Suzan Stephenson | Republican | ||
| Collector | Pamela S. Reed | Democratic | ||
| Commissioner (Presiding) |
Dick King | Republican | ||
| Commissioner (District 1) |
Mike Brown | Republican | ||
| Commissioner (District 2) |
Josh Muck | Republican | ||
| Coroner | Kenny F. Creason | Democratic | ||
| Prosecuting Attorney | Tracy L. Carlson | Democratic | ||
| Public Administrator | Kay Cunningham | Republican | ||
| Recorder | Loretta Brookshier | Democratic | ||
| Sheriff | Tom Parks | Democratic | ||
| Surveyor | Thomas Kelly | Republican | ||
| Treasurer | Pamela S. Reed | Democratic | ||
State
| Year | Republican | Democratic | Third Parties |
|---|---|---|---|
| 2016 | 61.38% 3,414 | 35.71% 1,986 | 2.91% 162 |
| 2012 | 44.43% 2,456 | 52.24% 2,888 | 3.33% 184 |
| 2008 | 40.10% 2,371 | 57.56% 3,403 | 2.33% 138 |
| 2004 | 55.11% 3,252 | 43.86% 2,588 | 1.04% 61 |
| 2000 | 48.02% 2,869 | 50.26% 3,003 | 1.72% 103 |
| 1996 | 30.31% 1,783 | 67.44% 3,967 | 2.24% 132 |
Linn County is split between two districts in Missouri’s House of Representatives, both of which are represented by Republicans.
- District 6 — Tim Remole (R-Excello). Consists of a thin slice of the eastern part of the county.
| Party | Candidate | Votes | % | ± | |
|---|---|---|---|---|---|
| Republican | Tim Remole | 1,199 | 100.00% | +47.81 | |
| Party | Candidate | Votes | % | ± | |
|---|---|---|---|---|---|
| Republican | Tim Remole | 441 | 52.19% | +0.65 | |
| Democratic | Robert Harrington | 404 | 47.81% | -0.65 | |
| Party | Candidate | Votes | % | ± | |
|---|---|---|---|---|---|
| Republican | Tim Remole | 635 | 51.54% | ||
| Democratic | Diane J. Scott | 597 | 48.46% | ||
- District 7 — Rusty Black (R-Chillicothe). Consists of the central and western parts of the county.
| Party | Candidate | Votes | % | ± | |
|---|---|---|---|---|---|
| Republican | Rusty Black | 3,648 | 100.00% | ||
| Party | Candidate | Votes | % | ± | |
|---|---|---|---|---|---|
| Republican | Mike Lair | 2,032 | 100.00% | +47.19 | |
| Party | Candidate | Votes | % | ± | |
|---|---|---|---|---|---|
| Republican | Mike Lair | 2,178 | 52.81% | ||
| Democratic | Harry Wyse | 1,946 | 47.19% | ||
All of Linn County is a part of Missouri’s 18th District in the Missouri Senate and is currently represented by Brian Munzingler (R-Williamstown).
| Party | Candidate | Votes | % | ± | |
|---|---|---|---|---|---|
| Republican | Brian Munzingler | 2,648 | 100.00% | ||
Federal
| Party | Candidate | Votes | % | ± | |
|---|---|---|---|---|---|
| Republican | Roy Blunt | 3,245 | 58.31% | +18.94 | |
| Democratic | Jason Kander | 2,058 | 36.98% | -15.83 | |
| Libertarian | Jonathan Dine | 136 | 2.44% | -5.38 | |
| Green | Johnathan McFarland | 70 | 1.26% | +1.26 | |
| Constitution | Fred Ryman | 56 | 1.01% | +1.01 | |
| Party | Candidate | Votes | % | ± | |
|---|---|---|---|---|---|
| Republican | Todd Akin | 2,190 | 39.37% | ||
| Democratic | Claire McCaskill | 2,911 | 52.81% | ||
| Libertarian | Jonathan Dine | 431 | 7.82% | ||
All of Linn County is included in Missouri’s 6th Congressional District and is currently represented by Sam Graves (R-Tarkio) in the U.S. House of Representatives.
| Party | Candidate | Votes | % | ± | |
|---|---|---|---|---|---|
| Republican | Sam Graves | 4,102 | 74.70% | +1.78 | |
| Democratic | David M. Blackwell | 1,235 | 22.49% | -0.79 | |
| Libertarian | Russ Lee Monchil | 82 | 1.49% | -0.18 | |
| Green | Mike Diel | 72 | 1.31% | +1.31 | |
| Party | Candidate | Votes | % | ± | |
|---|---|---|---|---|---|
| Republican | Sam Graves | 2,496 | 72.92% | +5.30 | |
| Democratic | Bill Hedge | 797 | 23.28% | -6.97 | |
| Libertarian | Russ Lee Monchil | 130 | 3.80% | +1.67 | |
| Party | Candidate | Votes | % | ± | |
|---|---|---|---|---|---|
| Republican | Sam Graves | 3,686 | 67.62% | ||
| Democratic | Kyle Yarber | 1,649 | 30.25% | ||
| Libertarian | Russ Lee Monchil | 116 | 2.13% | ||
| Year | Republican | Democratic | Third parties |
|---|---|---|---|
| 2016 | 73.2% 4,088 | 22.2% 1,240 | 4.6% 259 |
| 2012 | 60.3% 3,344 | 36.8% 2,041 | 3.0% 165 |
| 2008 | 52.9% 3,140 | 44.5% 2,638 | 2.6% 153 |
| 2004 | 58.0% 3,422 | 41.4% 2,440 | 0.6% 36 |
| 2000 | 54.0% 3,246 | 44.0% 2,646 | 2.0% 118 |
| 1996 | 35.6% 2,097 | 50.4% 2,967 | 14.0% 827 |
| 1992 | 30.6% 1,967 | 45.3% 2,916 | 24.1% 1,553 |
| 1988 | 49.2% 3,061 | 50.6% 3,150 | 0.3% 17 |
| 1984 | 55.1% 3,822 | 44.9% 3,112 | |
| 1980 | 49.6% 3,585 | 48.0% 3,467 | 2.4% 172 |
| 1976 | 43.0% 3,114 | 56.6% 4,092 | 0.4% 30 |
| 1972 | 59.9% 4,595 | 40.1% 3,073 | |
| 1968 | 46.1% 3,795 | 47.7% 3,933 | 6.2% 513 |
| 1964 | 33.5% 2,883 | 66.6% 5,735 | |
| 1960 | 52.9% 5,086 | 47.1% 4,534 | |
| 1956 | 49.9% 5,028 | 50.1% 5,055 | |
| 1952 | 51.6% 5,551 | 48.3% 5,189 | 0.1% 11 |
| 1948 | 41.0% 4,034 | 58.9% 5,788 | 0.1% 11 |
| 1944 | 48.5% 4,942 | 51.4% 5,242 | 0.1% 9 |
| 1940 | 47.5% 5,664 | 52.3% 6,246 | 0.2% 24 |
| 1936 | 43.0% 5,118 | 56.6% 6,744 | 0.4% 53 |
| 1932 | 36.6% 3,611 | 62.7% 6,177 | 0.7% 70 |
| 1928 | 61.3% 6,996 | 38.5% 4,395 | 0.2% 20 |
| 1924 | 45.8% 5,155 | 47.9% 5,386 | 6.3% 705 |
| 1920 | 51.1% 5,557 | 47.7% 5,184 | 1.3% 137 |
| 1916 | 44.0% 2,801 | 54.0% 3,441 | 2.0% 128 |
| 1912 | 24.2% 1,452 | 48.1% 2,890 | 27.7% 1,662 |
| 1908 | 48.7% 2,974 | 49.1% 3,000 | 2.3% 138 |
| 1904 | 52.6% 3,182 | 45.4% 2,748 | 2.0% 122 |
| 1900 | 49.0% 3,104 | 49.5% 3,137 | 1.6% 100 |
| 1896 | 47.2% 3,015 | 52.1% 3,327 | 0.8% 48 |
| 1892 | 45.0% 2,501 | 45.4% 2,523 | 9.7% 537 |
| 1888 | 46.2% 2,505 | 47.7% 2,588 | 6.1% 328 |
Communities
- Brookfield
- Browning (partly in Sullivan County)
- Bucklin
- Laclede
- Linneus (county seat)
- Marceline
- Meadville
- New Boston
- Purdin
- St. Catharine
Notable people
- Doris Akers, gospel singer and composer, was born in Brookfield and resided there until age five.
- Gene Bartow, Hall of Fame college basketball coach and NBA executive.
- Jeff Roe, Republican political consultant, was born in Brookfield and lived there until joining the army at age sixteen.
- Walt Disney, animator and founder of the Disney corporation, Disneyland, and Walt Disney World lived on a farm near Marceline as a young boy.
- General John J. Pershing, four-star General of the Armies and Commander of the American Expeditionary Forces during World War I, was born in Laclede.
See also
- National Register of Historic Places listings in Linn County, Missouri
- USS Linn County (LST-900)
References
- "State & County QuickFacts". United States Census Bureau. Archived from the original on June 7, 2011. Retrieved September 10, 2013.
- "Find a County". National Association of Counties. Retrieved 2011-06-07.
- Eaton, David Wolfe (1916). How Missouri Counties, Towns and Streams Were Named. The State Historical Society of Missouri. pp. 187.
- "2010 Census Gazetteer Files". United States Census Bureau. August 22, 2012. Archived from the original on September 13, 2014. Retrieved November 16, 2014.
- "Population and Housing Unit Estimates". Retrieved November 18, 2019.
- "U.S. Decennial Census". United States Census Bureau. Retrieved November 16, 2014.
- "Historical Census Browser". University of Virginia Library. Retrieved November 16, 2014.
- "Population of Counties by Decennial Census: 1900 to 1990". United States Census Bureau. Retrieved November 16, 2014.
- "Census 2000 PHC-T-4. Ranking Tables for Counties: 1990 and 2000" (PDF). United States Census Bureau. Retrieved November 16, 2014.
- "U.S. Census website". United States Census Bureau. Retrieved 2008-01-31.
- Breeding, Marshall. "Brookfield Public Library". Libraries.org. Retrieved May 8, 2017.
- Breeding, Marshall. "Marceline Carnegie Library". Libraries.org. Retrieved May 8, 2017.
- Leip, David. "Dave Leip's Atlas of U.S. Presidential Elections". uselectionatlas.org. Retrieved 2018-03-25.
Further reading
- A Compendium of History and Biography of Linn County Missouri (1912) online
External links
- Digitized 1930 Plat Book of Linn County from University of Missouri Division of Special Collections, Archives, and Rare Books
Places adjacent to Linn County, Missouri | ||||||||||
|---|---|---|---|---|---|---|---|---|---|---|
| ||||||||||
Municipalities and communities of Linn County, Missouri, United States | ||
|---|---|---|
| Cities | Map of Missouri highlighting Linn County | |
| Townships |
| |
| Unincorporated communities | ||
| Footnotes | ‡This populated place also has portions in an adjacent county or counties | |
| Authority control |
|
|---|