Livingston County, Missouri
Livingston County is a county located in the northwestern portion of the U.S. state of Missouri. As of the 2010 census, the population was 15,195.[1] Its county seat is Chillicothe.[2] The county was organized January 6, 1837, and named for U.S. Secretary of State Edward Livingston.[3]
Livingston County | |
|---|---|
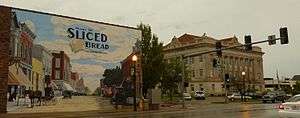
 Livingston County courthouse in Chillicothe | |
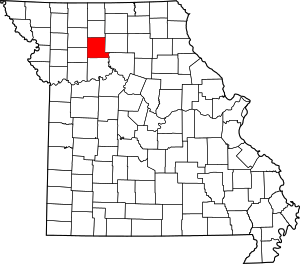 Location within the U.S. state of Missouri | |
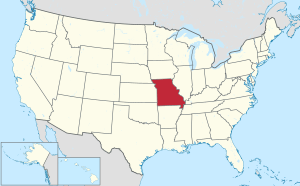 Missouri's location within the U.S. | |
| Coordinates: 39°47′N 93°33′W | |
| Country | |
| State | |
| Founded | January 6, 1837 |
| Named for | Edward Livingston |
| Seat | Chillicothe |
| Largest city | Chillicothe |
| Area | |
| • Total | 539 sq mi (1,400 km2) |
| • Land | 532 sq mi (1,380 km2) |
| • Water | 6.2 sq mi (16 km2) 1.2% |
| Population (2010) | |
| • Total | 15,195 |
| • Estimate (2018) | 15,146 |
| • Density | 28/sq mi (11/km2) |
| Time zone | UTC−6 (Central) |
| • Summer (DST) | UTC−5 (CDT) |
| Congressional district | 6th |
| Website | www |
Geography
According to the U.S. Census Bureau, the county has a total area of 539 square miles (1,400 km2), of which 532 square miles (1,380 km2) is land and 6.2 square miles (16 km2) (1.2%) is water.[4]
Adjacent counties
- Grundy County (north)
- Linn County (east)
- Chariton County (southeast)
- Carroll County (south)
- Caldwell County (southwest)
- Daviess County (northwest)
Major highways


Demographics
| Historical population | |||
|---|---|---|---|
| Census | Pop. | %± | |
| 1840 | 4,325 | — | |
| 1850 | 4,247 | −1.8% | |
| 1860 | 7,417 | 74.6% | |
| 1870 | 16,730 | 125.6% | |
| 1880 | 20,196 | 20.7% | |
| 1890 | 20,668 | 2.3% | |
| 1900 | 22,302 | 7.9% | |
| 1910 | 19,453 | −12.8% | |
| 1920 | 18,857 | −3.1% | |
| 1930 | 18,615 | −1.3% | |
| 1940 | 18,000 | −3.3% | |
| 1950 | 16,532 | −8.2% | |
| 1960 | 15,771 | −4.6% | |
| 1970 | 15,368 | −2.6% | |
| 1980 | 15,739 | 2.4% | |
| 1990 | 14,592 | −7.3% | |
| 2000 | 14,588 | 0.0% | |
| 2010 | 15,195 | 4.2% | |
| Est. 2018 | 15,146 | [5] | −0.3% |
| U.S. Decennial Census[6] 1790-1960[7] 1900-1990[8] 1990-2000[9] 2010-2015[1] | |||
As of the 2010 census, there were 15,195 people, 5,871 households and 3,834 families residing in the county. The population density was 28 per square mile (12/km²). There were 6,730 housing units at an average density of 12 per square mile (5/km²). The racial makeup of the county was 95.39% White, 2.42% Black or African American, 0.32% Native American, 0.28% Asian, 0.02% Pacific Islander, 0.38% from other races, and 1.20% from two or more races. Approximately 1.19% of the population were Hispanic or Latino of any race.
There were 5,871 households of which 29.59% had children under the age of 18 living with them, 51.29% were married couples living together, 10.00% had a female householder with no husband present, and 34.70% were non-families. 29.94% of all households were made up of individuals and 14.43% had someone living alone who was 65 years of age or older. The average household size was 2.36 and the average family size was 2.90.
Age distribution was 21.91% under the age of 18, 7.74% from 18 to 24, 25.34% from 25 to 44, 26.81% from 45 to 64, and 18.20% who were 65 years of age or older. The median age was 41 years. For every 100 females there were 81.02 males. For every 100 females age 18 and over, there were 76.47 males.
The median household income was $39,683, and the median family income was $53,325. Males had a median income of $38,282 versus $24,944 for females. The per capita income for the county was $20,295. About 15.8% of families and 20.6% of the population were below the poverty line, including 34.4% of those under age 18 and 18.4% of those age 65 or over.
Education
Public schools
- Chillicothe R-II School District – Chillicothe
- Garrison Elementary School (PK)
- Dewey Elementary School (K-01)
- Field Elementary School (02-03)
- Central Elementary School (04-05)
- Chillicothe Middle School (06-08)
- Chillicothe High School (09-12)
- Livingston County R-III School District – Chula
- Livingston County Elementary School (PK-08)
- Southwest Livingston County R-I School District – Ludlow
- Southwest Livingston County Elementary School (PK-06)
- Southwest Livingston County High School (07-12)
Private schools
- Bishop Hogan Memorial School – Chillicothe (K-09) – Roman Catholic
Public libraries
- Livingston County Library[10]
Politics
Local
The Democratic Party predominantly controls politics at the local level in Livingston County. Democrats hold all but two of the elected positions in the county.
| Livingston County, Missouri | ||||
|---|---|---|---|---|
| Elected countywide officials | ||||
| Assessor | Steve Ripley | Democratic | ||
| Circuit Clerk | Brenda Wright | Democratic | ||
| County Clerk | Sherry Parks | Democratic | ||
| Collector | Martha Peery | Democratic | ||
| Commissioner (Presiding) |
Eva Danner Horton | Democratic | ||
| Commissioner (District 1) |
Ken Lauhoff | Democratic | ||
| Commissioner (District 2) |
Todd Rodenberg | Democratic | ||
| Coroner | J. Scott Lindley | Democratic | ||
| Prosecuting Attorney | Adam L. Warren | Republican | ||
| Public Administrator | Sherry Parks | Democratic | ||
| Recorder | Kelly Christopher | Democratic | ||
| Sheriff | Steve Cox | Republican | ||
| Surveyor | Matthew Winkler | Democratic | ||
| Treasurer | Martha Peery | Democratic | ||
State
| Year | Republican | Democratic | Third Parties |
|---|---|---|---|
| 2016 | 66.09% 4,189 | 31.43% 1,992 | 2.48% 157 |
| 2012 | 48.72% 2,922 | 48.46% 2,906 | 2.82% 169 |
| 2008 | 43.74% 2,830 | 54.40% 3,520 | 1.86% 120 |
| 2004 | 58.25% 3,680 | 40.84% 2,580 | 0.92% 58 |
| 2000 | 51.99% 3,236 | 46.16% 2,873 | 1.85% 115 |
| 1996 | 29.66% 1,798 | 68.54% 4,155 | 1.80% 109 |
All of Livingston County is a part of Missouri’s 7th District in the Missouri House of Representatives and is currently represented by Rusty Black (R-Chillicothe).
| Party | Candidate | Votes | % | ± | |
|---|---|---|---|---|---|
| Republican | Rusty Black | 5,883 | 100.00% | ||
| Party | Candidate | Votes | % | ± | |
|---|---|---|---|---|---|
| Republican | Mike Lair | 3,442 | 100.00% | +37.86 | |
| Party | Candidate | Votes | % | ± | |
|---|---|---|---|---|---|
| Republican | Mike Lair | 3,721 | 62.14% | ||
| Democratic | Harry Wyse | 2,267 | 37.86 | ||
All of Livingston County is a part of Missouri’s 21st District in the Missouri Senate and is currently represented by Denny Hoskins (R-Warrensburg).
| Party | Candidate | Votes | % | ± | |
|---|---|---|---|---|---|
| Republican | Denny Hoskins | 4,575 | 75.77% | +7.67 | |
| Democratic | ElGene Ver Dught | 1,188 | 19.68% | -7.92 | |
| Libertarian | Bill Wayne | 275 | 4.55% | +0.25 | |
| Party | Candidate | Votes | % | ± | |
|---|---|---|---|---|---|
| Republican | David Pearce | 3,889 | 68.10% | ||
| Democratic | ElGene Ver Dught | 1,576 | 27.60% | ||
| Libertarian | Steven Hedrick | 246 | 4.30% | ||
Federal
| Party | Candidate | Votes | % | ± | |
|---|---|---|---|---|---|
| Republican | Roy Blunt | 3,834 | 60.41% | +16.88 | |
| Democratic | Jason Kander | 2,208 | 34.79% | -13.53 | |
| Libertarian | Jonathan Dine | 158 | 2.49% | -5.66 | |
| Green | Johnathan McFarland | 76 | 1.20% | +1.20 | |
| Constitution | Fred Ryman | 71 | 1.12% | +1.12 | |
| Party | Candidate | Votes | % | ± | |
|---|---|---|---|---|---|
| Republican | Todd Akin | 2,592 | 43.53% | ||
| Democratic | Claire McCaskill | 2,877 | 48.32% | ||
| Libertarian | Jonathan Dine | 485 | 8.15% | ||
All of Livingston County is included in Missouri’s 6th Congressional District and is currently represented by Sam Graves (R-Tarkio) in the U.S. House of Representatives.
| Party | Candidate | Votes | % | ± | |
|---|---|---|---|---|---|
| Republican | Sam Graves | 4,989 | 79.56% | +2.14 | |
| Democratic | David M. Blackwell | 1,112 | 17.73% | -1.74 | |
| Libertarian | Russ Lee Monchil | 114 | 1.82% | -1.29 | |
| Green | Mike Diel | 56 | 0.89% | +0.89 | |
| Party | Candidate | Votes | % | ± | |
|---|---|---|---|---|---|
| Republican | Sam Graves | 3,038 | 77.42% | +2.89 | |
| Democratic | Bill Hedge | 764 | 19.47% | -4.09 | |
| Libertarian | Russ Lee Monchil | 122 | 3.11% | +1.19 | |
| Party | Candidate | Votes | % | ± | |
|---|---|---|---|---|---|
| Republican | Sam Graves | 4,435 | 74.53% | ||
| Democratic | Kyle Yarber | 1,402 | 23.56% | ||
| Libertarian | Russ Lee Monchil | 114 | 1.92% | ||
| Year | Republican | Democratic | Third parties |
|---|---|---|---|
| 2016 | 76.0% 4,879 | 19.7% 1,265 | 4.3% 277 |
| 2012 | 66.2% 4,006 | 31.5% 1,906 | 2.4% 142 |
| 2008 | 60.9% 3,993 | 37.2% 2,435 | 1.9% 124 |
| 2004 | 63.5% 4,029 | 35.9% 2,278 | 0.6% 39 |
| 2000 | 59.1% 3,709 | 38.6% 2,425 | 2.3% 142 |
| 1996 | 38.9% 2,384 | 47.5% 2,913 | 13.6% 833 |
| 1992 | 34.5% 2,370 | 36.5% 2,505 | 29.0% 1,988 |
| 1988 | 52.9% 3,462 | 47.0% 3,077 | 0.1% 8 |
| 1984 | 60.2% 4,090 | 39.8% 2,699 | |
| 1980 | 50.3% 3,654 | 46.3% 3,368 | 3.4% 248 |
| 1976 | 43.9% 3,010 | 55.7% 3,819 | 0.4% 28 |
| 1972 | 66.4% 5,253 | 33.6% 2,662 | |
| 1968 | 49.0% 3,827 | 44.4% 3,467 | 6.6% 518 |
| 1964 | 33.7% 2,703 | 66.3% 5,320 | |
| 1960 | 57.1% 5,045 | 42.9% 3,795 | |
| 1956 | 57.7% 5,165 | 42.3% 3,785 | |
| 1952 | 59.8% 5,594 | 40.1% 3,757 | 0.1% 8 |
| 1948 | 47.8% 3,835 | 52.1% 4,182 | 0.2% 14 |
| 1944 | 54.6% 4,697 | 45.2% 3,887 | 0.3% 26 |
| 1940 | 53.2% 5,298 | 46.5% 4,633 | 0.3% 25 |
| 1936 | 47.0% 4,678 | 52.6% 5,226 | 0.4% 40 |
| 1932 | 43.4% 3,659 | 56.2% 4,742 | 0.4% 30 |
| 1928 | 63.9% 5,742 | 35.9% 3,221 | 0.2% 17 |
| 1924 | 50.3% 4,517 | 48.0% 4,316 | 1.7% 155 |
| 1920 | 57.5% 5,093 | 41.4% 3,666 | 1.1% 97 |
| 1916 | 47.5% 2,424 | 51.1% 2,609 | 1.5% 76 |
| 1912 | 18.4% 885 | 48.0% 2,314 | 33.6% 1,618 |
| 1908 | 48.9% 2,400 | 48.5% 2,379 | 2.6% 127 |
| 1904 | 48.1% 2,480 | 45.7% 2,356 | 6.2% 320 |
| 1900 | 45.3% 2,493 | 48.3% 2,659 | 6.4% 350 |
| 1896 | 41.0% 2,377 | 57.8% 3,351 | 1.2% 69 |
| 1892 | 39.0% 1,958 | 43.6% 2,190 | 17.4% 871 |
| 1888 | 42.7% 2,031 | 43.8% 2,082 | 13.5% 640 |
Missouri presidential preference primary (2008)
- Former U.S. Senator Hillary Clinton (D-New York) received more votes, a total of 948, than any candidate from either party in Livingston County during the 2008 presidential primary.
| Livingston County, Missouri | |
|---|---|
| 2008 Republican primary in Missouri | |
| John McCain | 488 (38.88%) |
| Mike Huckabee | 426 (33.94%) |
| Mitt Romney | 248 (19.76%) |
| Ron Paul | 75 (5.98%) |
| Livingston County, Missouri | |
|---|---|
| 2008 Democratic primary in Missouri | |
| Hillary Clinton | 948 (59.85%) |
| Barack Obama | 550 (34.72%) |
| John Edwards (withdrawn) | 68 (4.29%) |
| Uncommitted | {{{uncommitted}}} |
Communities
Cities
- Chillicothe (county seat)
- Chula
- Wheeling
Villages
Census-designated place
Other unincorporated place
Notable people
- Bower Slack Broaddus, U.S. Federal Judge
- Courtney W. Campbell, U.S. Representative from Florida (1953-1955)
- Ray and Faye Copeland, serial killers
- Claude B. Hutchison, botanist, professor, and Mayor of Berkeley, California (1955-1963)
- Jerry Litton, U.S. Representative from Missouri (1973-1976)
- Charles H. Mansur, U.S. Representative from Missouri (1887-1893)
- Shirley Collie Nelson, country music artist/actress
- Henry Moses Pollard, U.S. Representative from Missouri (1877-1879)
- John Quinn, Missouri State Representative (2001-2009)
- William Y. Slack, brigadier general and politician
- Clarence Edwin Watkins, publisher
- Mike Lair, Missouri State Representative (2009–Present) and former teacher
See also
- Haun's Mill massacre
- Mormon War (1838)
- National Register of Historic Places listings in Livingston County, Missouri
References
- "State & County QuickFacts". United States Census Bureau. Archived from the original on June 7, 2011. Retrieved September 10, 2013.
- "Find a County". National Association of Counties. Retrieved 2011-06-07.
- Eaton, David Wolfe (1916). How Missouri Counties, Towns and Streams Were Named. The State Historical Society of Missouri. pp. 188.
- "2010 Census Gazetteer Files". United States Census Bureau. August 22, 2012. Archived from the original on October 21, 2013. Retrieved November 16, 2014.
- "Population and Housing Unit Estimates". Retrieved November 18, 2019.
- "U.S. Decennial Census". United States Census Bureau. Retrieved November 16, 2014.
- "Historical Census Browser". University of Virginia Library. Retrieved November 16, 2014.
- "Population of Counties by Decennial Census: 1900 to 1990". United States Census Bureau. Retrieved November 16, 2014.
- "Census 2000 PHC-T-4. Ranking Tables for Counties: 1990 and 2000" (PDF). United States Census Bureau. Retrieved November 16, 2014.
- Breeding, Marshall. "Livingston County Library". Libraries.org. Retrieved May 8, 2017.
- Leip, David. "Dave Leip's Atlas of U.S. Presidential Elections". uselectionatlas.org. Retrieved 2018-03-25.
External links
- Livingston County Library
- Digitized 1930 Plat Book of Livingston County from University of Missouri Division of Special Collections, Archives, and Rare Books
Places adjacent to Livingston County, Missouri | ||||||||||
|---|---|---|---|---|---|---|---|---|---|---|
| ||||||||||
Municipalities and communities of Livingston County, Missouri, United States | ||
|---|---|---|
| Cities | Map of Missouri highlighting Livingston County | |
| Villages | ||
| Townships |
| |
| CDP | ||
| Unincorporated communities | ||
| Ghost towns | ||
| Authority control |
|
|---|