Oregon County, Missouri
Oregon County is a county located in the southern portion of the U.S. state of Missouri. As of the 2010 census, the population was 10,881.[1] Its county seat is Alton.[2] The county was officially organized on February 14, 1845, and was named for the Oregon Territory in the northwestern United States.
Oregon County | |
|---|---|
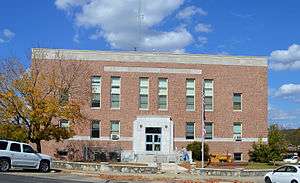 Oregon County Courthouse in Alton | |
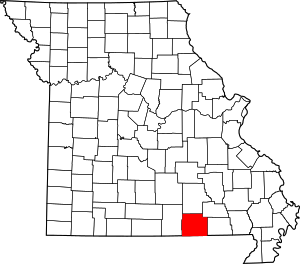 Location within the U.S. state of Missouri | |
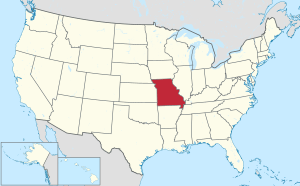 Missouri's location within the U.S. | |
| Coordinates: 36°41′N 91°24′W | |
| Country | |
| State | |
| Founded | February 14, 1845 |
| Named for | Oregon Territory |
| Seat | Alton |
| Largest city | Thayer |
| Area | |
| • Total | 792 sq mi (2,050 km2) |
| • Land | 790 sq mi (2,000 km2) |
| • Water | 1.7 sq mi (4 km2) 0.2% |
| Population (2010) | |
| • Total | 10,881 |
| • Estimate (2018) | 10,541 |
| • Density | 14/sq mi (5.3/km2) |
| Time zone | UTC−6 (Central) |
| • Summer (DST) | UTC−5 (CDT) |
| Congressional district | 8th |
Home to a large area of the Mark Twain National Forest, Oregon County contains more national forest acreage than any county in the state of Missouri. It also contains the Irish Wilderness, the largest federally protected wilderness area in the state. Hiking, backpacking, and horseback riding opportunities abound on the Ozark Trail and the White's Creek Trail. Canoeing, kayaking, jonboating, and fishing are popular on the Eleven Point River, which is Missouri's only National Wild and Scenic River.
Eleven Point State Park is under development east of Alton, Missouri that includes 6 miles of Eleven Point River frontage.
Grand Gulf State Park is just west of Thayer that includes a collapsed karst canyon.
History
Oregon County was created in 1845, at a time when the Oregon boundary dispute was a major issue.[3]
Geography
The county has a total area of 792 square miles (2,050 km2), of which 790 square miles (2,000 km2) is land and 1.7 square miles (4.4 km2) (0.2%) is water.[4] Arkansas is located to the south of Oregon County.
Adjacent counties
- Shannon County (north)
- Carter County (northeast)
- Ripley County (east)
- Randolph County, Arkansas (southeast)
- Sharp County, Arkansas (south)
- Fulton County, Arkansas (southwest)
- Howell County (west)
National protected area
- Mark Twain National Forest (part)
Demographics
| Historical population | |||
|---|---|---|---|
| Census | Pop. | %± | |
| 1850 | 1,432 | — | |
| 1860 | 3,009 | 110.1% | |
| 1870 | 3,287 | 9.2% | |
| 1880 | 5,791 | 76.2% | |
| 1890 | 10,467 | 80.7% | |
| 1900 | 13,906 | 32.9% | |
| 1910 | 14,681 | 5.6% | |
| 1920 | 12,889 | −12.2% | |
| 1930 | 12,220 | −5.2% | |
| 1940 | 13,390 | 9.6% | |
| 1950 | 11,978 | −10.5% | |
| 1960 | 9,845 | −17.8% | |
| 1970 | 9,180 | −6.8% | |
| 1980 | 10,238 | 11.5% | |
| 1990 | 9,470 | −7.5% | |
| 2000 | 10,344 | 9.2% | |
| 2010 | 10,881 | 5.2% | |
| Est. 2018 | 10,541 | [5] | −3.1% |
| U.S. Decennial Census[6] 1790-1960[7] 1900-1990[8] 1990-2000[9] 2010-2015[1] | |||
As of the census[10] of 2000, there were 10,344 people, 4,263 households, and 3,018 families residing in the county. The population density was 13 people per square mile (5/km²). There were 4,997 housing units at an average density of 6 per square mile (2/km²). The racial makeup of the county was 94.61% White, 0.10% Black or African American, 2.88% Native American, 0.14% Asian, 0.01% Pacific Islander, 0.08% from other races, and 2.19% from two or more races. Approximately 1.09% of the population were Hispanic or Latino of any race. Among the major first ancestries reported in Oregon County were 29.7% American, 13.4% English, 13.1% Irish, and 13.0% German.
There were 4,263 households out of which 29.30% had children under the age of 18 living with them, 58.80% were married couples living together, 8.40% had a female householder with no husband present, and 29.20% were non-families. 26.20% of all households were made up of individuals and 13.90% had someone living alone who was 65 years of age or older. The average household size was 2.40 and the average family size was 2.86.
In the county, the population was spread out with 24.30% under the age of 18, 7.00% from 18 to 24, 24.10% from 25 to 44, 26.50% from 45 to 64, and 18.00% who were 65 years of age or older. The median age was 41 years. For every 100 females there were 96.40 males. For every 100 women age 18 and over, there were 92.80 men.
The median income for a household in the county was $26,119, and the median income for a family was $31,637. Males had a median income of $22,304 versus $16,353 for females. The per capita income for the county was $15,043. About 16.30% of families and 22.00% of the population were below the poverty line, including 28.20% of those under age 18 and 20.00% of those age 65 or over. Of the state's 115 counties, in 2010 Oregon ranked last in terms of poverty.[11][12]
Religion
According to the Association of Religion Data Archives County Membership Report (2010), Oregon County is a part of the Bible Belt with evangelical Protestantism being the majority religion. The most predominant denominations among residents in Oregon County who adhere to a religion are Southern Baptists (46.0%), National Association of Free Will Baptists (30.1%), and Churches of Christ (9.1%).[13]
Politics
Local
| Oregon County, Missouri | ||||
|---|---|---|---|---|
| Elected countywide officials | ||||
| Assessor | Charles Alford | Democratic | ||
| Circuit Clerk | Betty Grooms | Republican | ||
| County Clerk | Tracy Bridges | Democratic | ||
| Collector | Misty Hower | Democratic | ||
| Commissioner (Presiding) |
Patrick Ledgerwood | Republican | ||
| Commissioner (District 1) |
Jason Kemper | Republican | ||
| Commissioner (District 2) |
Jon Hollis | Republican | ||
| Coroner | Tom Clary | Democratic | ||
| Prosecuting Attorney | Justin Nelson | Democratic | ||
| Public Administrator | Mindy Lawrence | Republican | ||
| Recorder | Dawn Holman | Democratic | ||
| Sheriff | Eric King | Republican | ||
| Surveyor | Scott Simer | Democratic | ||
| Treasurer | Linda Parrott | Republican | ||
Political control at the county level is currently divided between the Democratic and Republican parties. Social change has led some in the media to say Democrats now are getting the upper hand.
State
All of Oregon County is a part of the 143rd District in the Missouri House of Representatives and is currently represented by Jeffrey Pogue (R-Salem).
| Party | Candidate | Votes | % | ± | |
|---|---|---|---|---|---|
| Republican | Jeffrey Pogue | 3,801 | 100.00% | ||
| Party | Candidate | Votes | % | ± | |
|---|---|---|---|---|---|
| Republican | Jeffrey Pogue | 1,948 | 100.00% | +35.32% | |
| Party | Candidate | Votes | % | ± | |
|---|---|---|---|---|---|
| Republican | Jeffrey Pogue | 2,767 | 64.68% | ||
| Democratic | Shane Van Steenis | 1,511 | 35.32% | ||
All of Oregon County is a part of Missouri's 33rd District in the Missouri Senate and is currently represented by Mike Cunningham (R-Rogersville).
| Party | Candidate | Votes | % | ± | |
|---|---|---|---|---|---|
| Republican | Mike Cunningham | 3,833 | 100.00% | ||
| Party | Candidate | Votes | % | ± | |
|---|---|---|---|---|---|
| Republican | Mike Cunningham | 3,428 | 100.00% | ||
| Year | Republican | Democratic | Third Parties |
|---|---|---|---|
| 2016 | 66.82% 3,081 | 30.04% 1,385 | 3.14% 145 |
| 2012 | 50.01% 2,200 | 46.85% 2,061 | 3.14% 138 |
| 2008 | 38.07% 1,742 | 59.22% 2,710 | 2.71% 124 |
| 2004 | 55.76% 2,579 | 42.16% 1,950 | 2.08% 96 |
| 2000 | 45.82% 1,938 | 51.70% 2,187 | 2.48% 105 |
| 1996 | 38.02% 1,466 | 59.23% 2,284 | 2.75% 106 |
| 1992 | 39.27% 1,635 | 60.73% 2,529 | 0.00% 0 |
| 1988 | 53.00% 1,978 | 46.60% 1,739 | 0.40% 15 |
| 1984 | 52.93% 2,087 | 47.07% 1,856 | 0.00% 0 |
| 1980 | 40.12% 1,542 | 59.82% 2,299 | 0.05% 2 |
| 1976 | 37.19% 1,350 | 62.73% 2,277 | 0.08% 3 |
Federal
| Party | Candidate | Votes | % | ± | |
|---|---|---|---|---|---|
| Republican | Roy Blunt | 3,031 | 65.45% | +17.88 | |
| Democratic | Jason Kander | 1,385 | 29.91% | -16.59 | |
| Libertarian | Jonathan Dine | 105 | 2.27% | -3.66 | |
| Green | Johnathan McFarland | 53 | 1.14% | +1.14 | |
| Constitution | Fred Ryman | 57 | 1.23% | +1.23 | |
| Party | Candidate | Votes | % | ± | |
|---|---|---|---|---|---|
| Republican | Todd Akin | 2,095 | 47.57% | ||
| Democratic | Claire McCaskill | 2,048 | 46.50% | ||
| Libertarian | Jonathan Dine | 261 | 5.93% | ||
Oregon County is included in Missouri’s 8th Congressional District and is currently represented by Jason T. Smith (R-Salem) in the U.S. House of Representatives. Smith won a special election on Tuesday, June 4, 2013, to finish out the remaining term of U.S. Representative Jo Ann Emerson (R-Cape Girardeau). Emerson announced her resignation a month after being reelected with over 70 percent of the vote in the district. She resigned to become CEO of the National Rural Electric Cooperative.
| Party | Candidate | Votes | % | ± | |
|---|---|---|---|---|---|
| Republican | Jason T. Smith | 3,447 | 77.50% | +17.05 | |
| Democratic | Dave Cowell | 876 | 19.69% | -4.52 | |
| Libertarian | Jonathan Shell | 125 | 2.81% | +1.15 | |
| Party | Candidate | Votes | % | ± | |
|---|---|---|---|---|---|
| Republican | Jason T. Smith | 1,458 | 60.45% | +1.40 | |
| Democratic | Barbara Stocker | 584 | 24.21% | -6.35 | |
| Constitution | Doug Enyart | 76 | 3.15% | -6.11 | |
| Libertarian | Rick Vandeven | 40 | 1.66% | +0.53 | |
| Independent | Terry Hampton | 254 | 10.53% | +10.53 | |
| Party | Candidate | Votes | % | ± | |
|---|---|---|---|---|---|
| Republican | James T. Smith | 574 | 59.05% | -11.37 | |
| Democratic | Steve Hodges | 297 | 30.56% | +5.19 | |
| Constitution | Doug Enyart | 90 | 9.26% | +9.26 | |
| Libertarian | Bill Slantz | 11 | 1.13% | -3.08 | |
| Party | Candidate | Votes | % | ± | |
|---|---|---|---|---|---|
| Republican | Jo Ann Emerson | 3,061 | 70.42% | ||
| Democratic | Jack Rushin | 1,103 | 25.37% | ||
| Libertarian | Rick Vandeven | 183 | 4.21% | ||
Political culture
| Year | Republican | Democratic | Third parties |
|---|---|---|---|
| 2016 | 78.6% 3,671 | 18.5% 865 | 2.8% 132 |
| 2012 | 65.3% 2,886 | 32.1% 1,419 | 2.6% 116 |
| 2008 | 57.8% 2,652 | 39.5% 1,811 | 2.8% 128 |
| 2004 | 59.3% 2,769 | 39.0% 1,823 | 1.7% 81 |
| 2000 | 59.6% 2,521 | 37.0% 1,568 | 3.4% 144 |
| 1996 | 39.1% 1,502 | 46.7% 1,795 | 14.2% 544 |
| 1992 | 33.1% 1,402 | 53.3% 2,258 | 13.6% 576 |
| 1988 | 45.6% 1,717 | 54.2% 2,042 | 0.2% 7 |
| 1984 | 49.4% 1,979 | 50.6% 2,026 | |
| 1980 | 39.1% 1,523 | 59.7% 2,326 | 1.3% 49 |
| 1976 | 30.2% 1,122 | 69.1% 2,564 | 0.7% 26 |
| 1972 | 61.0% 2,118 | 39.0% 1,352 | |
| 1968 | 34.0% 1,213 | 48.4% 1,726 | 17.5% 625 |
| 1964 | 25.4% 992 | 74.6% 2,908 | |
| 1960 | 50.5% 1,974 | 49.5% 1,934 | |
| 1956 | 36.8% 1,436 | 63.3% 2,472 | |
| 1952 | 38.0% 1,804 | 61.7% 2,926 | 0.3% 14 |
| 1948 | 27.9% 1,214 | 71.9% 3,133 | 0.2% 10 |
| 1944 | 36.5% 1,573 | 63.4% 2,734 | 0.2% 7 |
| 1940 | 33.6% 1,826 | 66.1% 3,593 | 0.3% 15 |
| 1936 | 29.4% 1,461 | 70.5% 3,504 | 0.1% 5 |
| 1932 | 17.8% 786 | 81.4% 3,599 | 0.9% 38 |
| 1928 | 46.8% 1,662 | 53.1% 1,884 | 0.1% 4 |
| 1924 | 25.7% 896 | 64.0% 2,231 | 10.3% 360 |
| 1920 | 39.6% 1,319 | 58.8% 1,961 | 1.6% 53 |
| 1916 | 25.9% 660 | 70.7% 1,799 | 3.4% 87 |
| 1912 | 18.1% 486 | 62.9% 1,688 | 18.9% 508 |
| 1908 | 30.3% 729 | 64.5% 1,550 | 5.2% 126 |
| 1904 | 33.7% 693 | 59.1% 1,215 | 7.2% 147 |
| 1900 | 26.4% 652 | 71.6% 1,768 | 1.9% 48 |
| 1896 | 24.4% 576 | 75.4% 1,783 | 0.3% 6 |
| 1892 | 19.6% 318 | 69.1% 1,118 | 11.3% 183 |
| 1888 | 23.6% 360 | 75.9% 1,157 | 0.5% 8 |
At the presidential level, Oregon County is a fairly independent-leaning or battleground county. While George W. Bush carried Oregon County in 2000 and 2004, the margins of victory were smaller than in many of the other rural areas. Bill Clinton also carried Oregon County both times in 1992 and 1996. Like most of the other rural counties in Missouri, Oregon County favored John McCain over Barack Obama in 2008.
Like most rural areas throughout Southeast Missouri, voters in Oregon County generally adhere to socially and culturally conservative principles. In 2004, Missourians voted on a constitutional amendment to define marriage as the union between a man and a woman—it overwhelmingly passed Oregon County with 87.09 percent of the vote. The initiative passed the state with 71 percent of support from voters as Missouri became the first state to ban same-sex marriage. In 2006, Missourians voted on a constitutional amendment to fund and legalize embryonic stem cell research in the state—it failed in Oregon County with 56.78 percent voting against the measure. The initiative narrowly passed the state with 51 percent of support from voters as Missouri became one of the first states in the nation to approve embryonic stem cell research. Despite Oregon County’s longstanding tradition of supporting socially conservative platforms, voters in the county have a penchant for advancing populist causes like increasing the minimum wage. In 2006, Missourians voted on a proposition (Proposition B) to increase the minimum wage in the state to $6.50 an hour—it passed Oregon County with 73.14 percent of the vote. The proposition strongly passed every single county in Missouri with 75.94 percent voting in favor as the minimum wage was increased to $6.50 an hour in the state. During the same election, voters in five other states also strongly approved increases in the minimum wage.
Missouri presidential preference primary (2008)
| Oregon County, Missouri | |
|---|---|
| 2008 Republican primary in Missouri | |
| John McCain | 242 (20.47%) |
| Mike Huckabee | 696 (58.88%) |
| Mitt Romney | 134 (11.34%) |
| Ron Paul | 101 (8.54%) |
| Oregon County, Missouri | |
|---|---|
| 2008 Democratic primary in Missouri | |
| Hillary Clinton | 989 (71.77%) |
| Barack Obama | 332 (24.09%) |
| John Edwards (withdrawn) | 42 (3.05%) |
In the 2008 presidential primary, voters in Oregon County from both political parties supported candidates who finished in second place in the state at large and nationally.
- Former U.S. Senator Hillary Clinton (D-New York) received more votes, a total of 989, than any candidate from either party in Oregon County during the 2008 presidential primary.
Education
Of adults 25 years of age and older in Oregon County, 72.0% possesses a high school diploma or higher while 9.1% holds a bachelor's degree or higher as their highest educational attainment.
Public schools
- Alton R-IV School District - Alton
- Alton Elementary School (K-06)
- Alton High School (07-12)
- Couch R-I School District - Myrtle
- Couch Elementary School (K-06)
- Couch High School (07-12)
- Oregon-Howell R-III School District - Koshkonong
- Koshkonong Elementary School (K-06)
- Koshkonong High School (07-12)
- Thayer R-II School District - Thayer
- Thayer Elementary School (K-06)
- Thayer High School (07-12)
Public libraries
- Oregon County Library District[16]
See also
- National Register of Historic Places listings in Oregon County, Missouri
References
- "State & County QuickFacts". United States Census Bureau. Archived from the original on June 7, 2011. Retrieved September 12, 2013.
- "Find a County". National Association of Counties. Archived from the original on May 31, 2011. Retrieved 2011-06-07.
- Eaton, David Wolfe (1917). How Missouri Counties, Towns and Streams Were Named. The State Historical Society of Missouri. p. 337.
- "2010 Census Gazetteer Files". United States Census Bureau. August 22, 2012. Archived from the original on October 21, 2013. Retrieved November 17, 2014.
- "Population and Housing Unit Estimates". Retrieved November 13, 2019.
- "U.S. Decennial Census". United States Census Bureau. Retrieved November 17, 2014.
- "Historical Census Browser". University of Virginia Library. Retrieved November 17, 2014.
- "Population of Counties by Decennial Census: 1900 to 1990". United States Census Bureau. Retrieved November 17, 2014.
- "Census 2000 PHC-T-4. Ranking Tables for Counties: 1990 and 2000" (PDF). United States Census Bureau. Retrieved November 17, 2014.
- "U.S. Census website". United States Census Bureau. Retrieved 2008-01-31.
- "SELECTED ECONOMIC CHARACTERISTICS 2006-2010 American Community Survey 5-Year Estimates". U.S. Census Bureau. Archived from the original on 2020-02-12. Retrieved 2012-11-25.
- "Profile of General Population and Housing Characteristics: 2010 Demographic Profile Data". U.S. Census Bureau. Archived from the original on 2019-05-21. Retrieved 2012-11-25.
- "Oregon County (Missouri)". The Association of Religion Data Archives County Membership Report. 2010. Retrieved 23 July 2019.
- "County Results - State of Missouri - 2016 General Election - November 8, 2016 - Official Results". Missouri Secretary of State. December 8, 2016. Retrieved May 2, 2017.
- Leip, David. "Dave Leip's Atlas of U.S. Presidential Elections". uselectionatlas.org. Retrieved 2018-03-26.
- Breeding, Marshall. "Oregon County Library District". Libraries.org. Retrieved May 8, 2017.
External links
- Digitized 1930 Plat Book of Oregon County from University of Missouri Division of Special Collections, Archives, and Rare Books
- Geologic Map of the Piedmont Hollow Quadrangle, Oregon County, Missouri United States Geological Survey

- Oregon County Sheriff's Office
Places adjacent to Oregon County, Missouri | |
|---|---|
Municipalities and communities of Oregon County, Missouri, United States | ||
|---|---|---|
| Cities | Map of Missouri highlighting Oregon County | |
| Townships |
| |
| CDP | ||
| Other unincorporated communities | ||
| Ghost towns | ||
| Authority control |
|
|---|