Osage County, Missouri
Osage County is a county in the central part of the U.S. state of Missouri. As of the 2010 census, the population was 13,878.[1] Its county seat is Linn.[2] The county was organized January 29, 1841, and named from the Osage River.[3]
Osage County | |
|---|---|
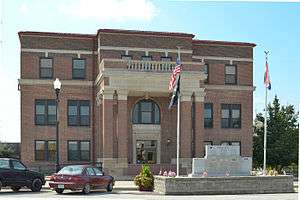 Osage County Courthouse in Linn | |
 Location within the U.S. state of Missouri | |
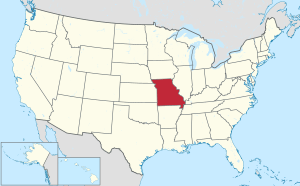 Missouri's location within the U.S. | |
| Coordinates: 38°28′N 91°52′W | |
| Country | |
| State | |
| Founded | January 29, 1841 |
| Named for | Osage River |
| Seat | Linn |
| Largest city | Linn |
| Area | |
| • Total | 611 sq mi (1,580 km2) |
| • Land | 604 sq mi (1,560 km2) |
| • Water | 6.1 sq mi (16 km2) 1.0% |
| Population (2010) | |
| • Total | 13,878 |
| • Estimate (2018) | 13,714 |
| • Density | 23/sq mi (8.8/km2) |
| Time zone | UTC−6 (Central) |
| • Summer (DST) | UTC−5 (CDT) |
| Congressional district | 3rd |
| Website | osagecountygov |
Osage County is part of the Jefferson City, MO Metropolitan Statistical Area. Its geography and the founding of Westphalia Vineyards links it to the Missouri Rhineland, extending along the Missouri River valley to the western edges of the St. Louis Metropolitan Area. Westphalia Vineyards, although started only in 2005, won the gold medal in the National Norton Festival Wine Competition in St. Louis in 2007 for the top-rated wine from the Norton grape.[4]
According to data from the 2010 census, Osage County is the whitest county in Missouri, with 98.85 percent of residents being white.
Geography
According to the U.S. Census Bureau, the county has a total area of 610 square miles (1,600 km2), of which 604 square miles (1,560 km2) is land and 6.1 square miles (16 km2) (1.0%) is water.[5]
Adjacent counties
- Callaway County (north)
- Gasconade County (east)
- Maries County (south)
- Miller County (southwest)
- Cole County (west)
- Montgomery County (northeast)
Demographics
| Historical population | |||
|---|---|---|---|
| Census | Pop. | %± | |
| 1850 | 6,704 | — | |
| 1860 | 7,879 | 17.5% | |
| 1870 | 10,793 | 37.0% | |
| 1880 | 11,824 | 9.6% | |
| 1890 | 13,080 | 10.6% | |
| 1900 | 14,096 | 7.8% | |
| 1910 | 14,283 | 1.3% | |
| 1920 | 13,559 | −5.1% | |
| 1930 | 12,462 | −8.1% | |
| 1940 | 12,375 | −0.7% | |
| 1950 | 11,301 | −8.7% | |
| 1960 | 10,867 | −3.8% | |
| 1970 | 10,994 | 1.2% | |
| 1980 | 12,014 | 9.3% | |
| 1990 | 12,018 | 0.0% | |
| 2000 | 13,062 | 8.7% | |
| 2010 | 13,878 | 6.2% | |
| Est. 2018 | 13,714 | [6] | −1.2% |
| U.S. Decennial Census[7] 1790-1960[8] 1900-1990[9] 1990-2000[10] 2010-2015[1] | |||
As of the census[11] of 2000, there were 13,062 people, 4,922 households, and 3,578 families residing in the county. The population density was 22 people per square mile (8/km²). There were 5,904 housing units at an average density of 10 per square mile (4/km²). The racial makeup of the county was 98.64% White, 0.16% Black or African American, 0.24% Native American, 0.08% Asian, 0.02% Pacific Islander, 0.07% from other races, and 0.80% from two or more races. Approximately 0.59% of the population were Hispanic or Latino of any race.
There were 4,922 households out of which 34.90% had children under the age of 18 living with them, 61.70% were married couples living together, 6.70% had a female householder with no husband present, and 27.30% were non-families. 23.80% of all households were made up of individuals and 10.80% had someone living alone who was 65 years of age or older. The average household size was 2.61 and the average family size was 3.10.
In the county, the population was spread out with 26.30% under the age of 18, 9.50% from 18 to 24, 27.70% from 25 to 44, 21.70% from 45 to 64, and 14.70% who were 65 years of age or older. The median age was 36 years. For every 100 females, there were 103.00 males. For every 100 females age 18 and over, there were 102.50 males.
The median income for a household in the county was $39,565, and the median income for a family was $46,503. Males had a median income of $29,538 versus $22,353 for females. The per capita income for the county was $17,245. About 5.90% of families and 8.30% of the population were below the poverty line, including 9.00% of those under age 18 and 10.40% of those age 65 or over.
Education
Public schools
- Osage County R-I School District – Chamois
- Osage County R-I Elementary School (PK-06)
- Chamois High School (07-12)
- Osage County R-II School District – Linn
- Osage County R-II Elementary School (PK-06)
- Linn High School (07-12)
- Osage County R-III School District – Westphalia
- Fatima Elementary School (PK-06)
- Fatima High School (07-12)
Private schools
- St. Joseph Catholic School – Westphalia (K-09) – Roman Catholic
- Immaculate Conception School – Loose Creek (K-09) – Roman Catholic
- St. George School – Linn (K-09) – Roman Catholic
- Sacred Heart School – Rich Fountain (K-09) – Roman Catholic
- Holy Family School – Freeburg (K-09) – Roman Catholic
- St. Mary’s School – Bonnots Mill (K-09) – Roman Catholic
Post-secondary
- State Technical College of Missouri - Linn, Missouri
Public libraries
Politics
Local
The Republican Party mostly controls politics at the local level in Osage County. Republicans hold over half of the elected positions in the county.
| Osage County, Missouri | ||||
|---|---|---|---|---|
| Elected countywide officials | ||||
| Assessor | Jerry Baker, Jr. | Republican | ||
| Circuit Clerk | Beth Billington | Democratic | ||
| County Clerk | Nicci Bouse | Republican | ||
| Collector | Denise Nolte | Republican | ||
| Commissioner (Presiding) |
Darryl Griffin | Republican | ||
| Commissioner (District 1) |
John Glavin | Republican | ||
| Commissioner (District 2) |
Larry Kliethermes | Republican | ||
| Coroner | Lois Jaegers | Independent | ||
| Prosecuting Attorney | Amanda L. Grellner | Democratic | ||
| Public Administrator | Paul G. Stratman | Republican | ||
| Recorder | Cindy Hoffman | Democratic | ||
| Sheriff | Michael Bonham | Republican | ||
| Surveyor | Timothy Hamburg | Democratic | ||
| Treasurer | Tim G. Neuner | Republican | ||
State
| Year | Republican | Democratic | Third Parties |
|---|---|---|---|
| 2016 | 64.64% 4,579 | 32.76% 2,321 | 2.60% 184 |
| 2012 | 58.37% 4,016 | 39.42% 2,712 | 2.21% 152 |
| 2008 | 59.51% 4,212 | 39.45% 2,792 | 1.04% 74 |
| 2004 | 68.67% 4,586 | 30.61% 2,044 | 0.71% 48 |
| 2000 | 55.78% 3,450 | 42.78% 2,646 | 1.44% 89 |
| 1996 | 38.80% 2,151 | 59.33% 3,289 | 1.88% 104 |
Osage County is split between two of the districts that elect members of the Missouri House of Representatives, and both are represented by Republicans.
- District 61 — Aaron Griesheimer). Consists of the northern half of the county.
| Party | Candidate | Votes | % | ± | |
|---|---|---|---|---|---|
| Republican | Aaron D. Griesheimer | 1,909 | 81.54% | +5.00 | |
| Democratic | Pamela A. Menefee | 431 | 18.41% | -5.00 | |
| Party | Candidate | Votes | % | ± | |
|---|---|---|---|---|---|
| Republican | Justin Alferman | 2,147 | 74.63% | -1.48 | |
| Democratic | Tom Smith | 593 | 20.61% | +1.48 | |
| Party | Candidate | Votes | % | ± | |
|---|---|---|---|---|---|
| Republican | Dave Schatz | 1,965 | 74.80% | ||
| Democratic | Michael Sage | 662 | 25.20% | ||
| Party | Candidate | Votes | % | ± | |
|---|---|---|---|---|---|
| Republican | Tom Hurst | 3,906 | 100.00% | ||
| Party | Candidate | Votes | % | ± | |
|---|---|---|---|---|---|
| Republican | Tom Hurst | 2,195 | 100.00% | +32.51 | |
| Party | Candidate | Votes | % | ± | |
|---|---|---|---|---|---|
| Republican | Tom Hurst | 2,755 | 67.49% | ||
| Democratic | Greg Stratman | 1,327 | 32.51% | ||
All of Osage County is a part of Missouri’s 6th District in the Missouri Senate and is currently represented by Mike Kehoe (R-Jefferson City).
| Party | Candidate | Votes | % | ± | |
|---|---|---|---|---|---|
| Republican | Mike Kehoe | 3,541 | 85.63% | ||
| Democratic | Mollie Kristen Fairbairn | 594 | 14.37% | ||
Federal
| Party | Candidate | Votes | % | ± | |
|---|---|---|---|---|---|
| Republican | Josh Hawley | 4,626 | 76.04% | +9.30 | |
| Democratic | Claire McCaskill | 1,255 | 20.63% | -5.75 | |
| Libertarian | Japeth Campbell | 44 | 0.72% | +0.72 | |
| Green | Jo Crain | 28 | 0.46% | +0.46 | |
| Independent | Craig O'Dear | 80 | 1.31% | +1.31 | |
| Party | Candidate | Votes | % | ± | |
|---|---|---|---|---|---|
| Republican | Todd Akin | 3,986 | 58.49% | ||
| Democratic | Claire McCaskill | 2,359 | 34.61% | ||
| Libertarian | Jonathan Dine | 470 | 6.90% | ||
All of Osage County is included in Missouri’s 3rd Congressional District and is currently represented by Blaine Luetkemeyer (R-St. Elizabeth) in the U.S. House of Representatives.
| Party | Candidate | Votes | % | ± | |
|---|---|---|---|---|---|
| Republican | Blaine Luetkemeyer | 5,956 | 84.89% | +2.02 | |
| Democratic | Kevin Miller | 889 | 12.67% | -1.71 | |
| Libertarian | Dan Hogan | 122 | 1.74% | -0.94 | |
| Constitution | Doanita Simmons | 49 | 0.70% | +0.70 | |
| Party | Candidate | Votes | % | ± | |
|---|---|---|---|---|---|
| Republican | Blaine Luetkemeyer | 3,435 | 82.87% | -0.58 | |
| Democratic | Courtney Denton | 596 | 14.38% | -0.13 | |
| Libertarian | Steven Hedrick | 111 | 2.68% | +0.64 | |
| Write-in | Harold Davis | 3 | 0.07% | +0.07 | |
| Party | Candidate | Votes | % | ± | |
|---|---|---|---|---|---|
| Republican | Blaine Luetkemeyer | 5,694 | 83.45% | ||
| Democratic | Eric C. Meyer | 990 | 14.51% | ||
| Libertarian | Steven Wilson | 139 | 2.04% | ||
Political culture
| Year | Republican | Democratic | Third parties |
|---|---|---|---|
| 2016 | 82.6% 5,856 | 14.1% 998 | 3.3% 236 |
| 2012 | 77.0% 5,329 | 21.3% 1,473 | 1.7% 117 |
| 2008 | 71.5% 5,062 | 26.9% 1,907 | 1.6% 110 |
| 2004 | 74.6% 4,975 | 25.1% 1,673 | 0.3% 23 |
| 2000 | 67.2% 4,154 | 31.4% 1,938 | 1.4% 86 |
| 1996 | 51.9% 2,890 | 36.7% 2,045 | 11.4% 633 |
| 1992 | 45.8% 2,784 | 30.6% 1,860 | 23.5% 1,429 |
| 1988 | 68.6% 3,885 | 31.3% 1,771 | 0.2% 9 |
| 1984 | 76.5% 4,381 | 23.5% 1,343 | |
| 1980 | 63.2% 3,679 | 35.1% 2,045 | 1.7% 98 |
| 1976 | 61.2% 3,224 | 38.2% 2,015 | 0.6% 30 |
| 1972 | 74.2% 4,266 | 25.8% 1,485 | |
| 1968 | 61.6% 3,107 | 30.6% 1,540 | 7.8% 394 |
| 1964 | 51.0% 2,712 | 49.0% 2,608 | |
| 1960 | 48.0% 2,678 | 52.0% 2,900 | |
| 1956 | 55.7% 3,077 | 44.3% 2,445 | |
| 1952 | 60.7% 3,404 | 39.1% 2,191 | 0.2% 10 |
| 1948 | 48.1% 2,488 | 51.7% 2,672 | 0.2% 10 |
| 1944 | 60.7% 3,284 | 39.2% 2,121 | 0.1% 7 |
| 1940 | 61.5% 3,743 | 38.3% 2,332 | 0.2% 11 |
| 1936 | 48.1% 2,836 | 50.8% 2,995 | 1.2% 68 |
| 1932 | 33.4% 1,798 | 66.2% 3,567 | 0.4% 22 |
| 1928 | 44.4% 2,474 | 55.5% 3,092 | 0.1% 6 |
| 1924 | 52.0% 2,496 | 41.4% 1,986 | 6.7% 320 |
| 1920 | 76.2% 3,699 | 23.0% 1,118 | 0.8% 39 |
| 1916 | 55.6% 1,769 | 43.4% 1,383 | 1.0% 32 |
| 1912 | 33.6% 981 | 47.7% 1,394 | 18.8% 548 |
| 1908 | 55.2% 1,820 | 43.7% 1,439 | 1.1% 36 |
| 1904 | 52.7% 1,699 | 45.0% 1,451 | 2.3% 74 |
| 1900 | 54.3% 1,731 | 43.8% 1,396 | 1.9% 62 |
| 1896 | 53.3% 1,700 | 45.6% 1,456 | 1.1% 36 |
| 1892 | 51.2% 1,378 | 47.1% 1,266 | 1.7% 46 |
| 1888 | 54.0% 1,446 | 44.5% 1,190 | 1.5% 40 |
Missouri presidential preference primary (2016)
- Donald J. Trump received more votes, a total of 1,316, than any candidate from either party in Osage County during the 2016 presidential primary.
| Osage County, Missouri | |
|---|---|
| 2008 Republican primary in Missouri | |
| John McCain | 665 (33.47%) |
| Mike Huckabee | 628 (31.61%) |
| Mitt Romney | 610 (30.70%) |
| Ron Paul | 42 (2.11%) |
| Osage County, Missouri | |
|---|---|
| 2008 Democratic primary in Missouri | |
| Hillary Clinton | 874 (56.4%) |
| Barack Obama | 609 (39.47%) |
| John Edwards (withdrawn) | 42 (2.72%) |
Communities
- Argyle
- Belle (mostly in Maries County)
- Bland (mostly in Gasconade County)
- Bonnots Mill
- Chamois
- Folk
- Frankenstein
- Freeburg
- Koeltztown
- Koenig
- Linn (county seat)
- Loose Creek
- Meta
- Rich Fountain
- Westphalia
References
- "State & County QuickFacts". United States Census Bureau. Archived from the original on June 7, 2011. Retrieved September 12, 2013.
- "Find a County". National Association of Counties. Retrieved 2011-06-07.
- Eaton, David Wolfe (1917). How Missouri Counties, Towns and Streams Were Named. The State Historical Society of Missouri. pp. 337.
- , Westphalia Vineyards, accessed 20 June 2008
- "2010 Census Gazetteer Files". United States Census Bureau. August 22, 2012. Archived from the original on October 21, 2013. Retrieved November 17, 2014.
- "Population and Housing Unit Estimates". Retrieved November 13, 2019.
- "U.S. Decennial Census". United States Census Bureau. Retrieved November 17, 2014.
- "Historical Census Browser". University of Virginia Library. Retrieved November 17, 2014.
- "Population of Counties by Decennial Census: 1900 to 1990". United States Census Bureau. Retrieved November 17, 2014.
- "Census 2000 PHC-T-4. Ranking Tables for Counties: 1990 and 2000" (PDF). United States Census Bureau. Retrieved November 17, 2014.
- "U.S. Census website". United States Census Bureau. Retrieved 2008-01-31.
- Breeding, Marshall. "Osage County Library". Libraries.org. Retrieved May 8, 2017.
- Leip, David. "Dave Leip's Atlas of U.S. Presidential Elections". uselectionatlas.org. Retrieved 2018-03-26.
Further reading
- History of Cole, Moniteau, Morgan, Benton, Miller, Maries and Osage counties, Missouri : from the earliest time to the present, including a department devoted to the preservation of sundry personal, business, professional and the private records; besides a valuable fund of notes, original observations, etc. etc. (1889) online
External links
- The Osage County Branch of the Missouri River Regional Library
- Westphalia Vineyards Official Website
- Osage Community Players, Inc.
- Digitized 1930 Plat Book of Osage County from University of Missouri Division of Special Collections, Archives, and Rare Books
Places adjacent to Osage County, Missouri | ||||||||||
|---|---|---|---|---|---|---|---|---|---|---|
| ||||||||||
Municipalities and communities of Osage County, Missouri, United States | ||
|---|---|---|
| Cities | Map of Missouri highlighting Osage County | |
| Villages | ||
| Townships | ||
| Unincorporated communities | ||
| Ghost towns | ||
| Footnotes | ‡This populated place also has portions in an adjacent county or counties | |

| Authority control |
|
|---|