Butler County, Missouri
Butler County is a county located in the southeast Ozark Foothills Region in the U.S. state of Missouri. As of the 2010 Census, the county's population was 42,794.[1] The largest city and county seat is Poplar Bluff.[2] The county was officially organized from Wayne County on February 27, 1849, and is named after former U.S. Representative William O. Butler (D-Kentucky), who was also an unsuccessful candidate for Vice President of the United States.[3] The first meeting in the Butler County Courthouse was held on June 18, 1849.
Butler County | |
|---|---|
 Butler County Courthouse, October 2014 | |
 Location within the U.S. state of Missouri | |
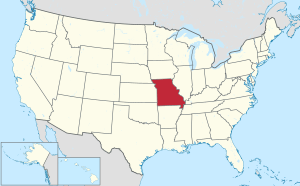 Missouri's location within the U.S. | |
| Coordinates: 36°43′N 90°24′W | |
| Country | |
| State | |
| Founded | February 27, 1849 |
| Named for | William Orlando Butler |
| Seat | Poplar Bluff |
| Largest city | Poplar Bluff |
| Area | |
| • Total | 699 sq mi (1,810 km2) |
| • Land | 695 sq mi (1,800 km2) |
| • Water | 4.3 sq mi (11 km2) 0.6% |
| Population (2010) | |
| • Total | 42,794 |
| • Estimate (2018) | 42,639 |
| • Density | 61/sq mi (24/km2) |
| Time zone | UTC−6 (Central) |
| • Summer (DST) | UTC−5 (CDT) |
| Congressional district | 8th |
| Website | butlercountymo |
Butler County comprises the Poplar Bluff, MO Micropolitan Statistical Area.
Geography
According to the U.S. Census Bureau, the county has a total area of 699 square miles (1,810 km2), of which 695 square miles (1,800 km2) is land and 4.3 square miles (11 km2) (0.6%) is water.[4]
Adjacent counties
- Wayne County (north)
- Stoddard County (northeast)
- Dunklin County (southeast)
- Clay County, Arkansas (south)
- Ripley County (west)
- Carter County (northwest)
Major highways
.svg.png)


National protected area
- Mark Twain National Forest (part)
Demographics
| Historical population | |||
|---|---|---|---|
| Census | Pop. | %± | |
| 1850 | 1,616 | — | |
| 1860 | 2,891 | 78.9% | |
| 1870 | 4,298 | 48.7% | |
| 1880 | 6,011 | 39.9% | |
| 1890 | 10,164 | 69.1% | |
| 1900 | 16,769 | 65.0% | |
| 1910 | 20,624 | 23.0% | |
| 1920 | 24,106 | 16.9% | |
| 1930 | 23,697 | −1.7% | |
| 1940 | 34,276 | 44.6% | |
| 1950 | 37,707 | 10.0% | |
| 1960 | 34,656 | −8.1% | |
| 1970 | 33,529 | −3.3% | |
| 1980 | 37,693 | 12.4% | |
| 1990 | 38,765 | 2.8% | |
| 2000 | 40,867 | 5.4% | |
| 2010 | 42,794 | 4.7% | |
| Est. 2018 | 42,639 | [5] | −0.4% |
| U.S. Decennial Census[6] 1790-1960[7] 1900-1990[8] 1990-2000[9] 2010-2015[1] | |||
As of the census[10] of 2000, there were 40,867 people, 16,718 households, and 11,318 families residing in the county. The population density was 59 people per square mile (23/km²). There were 18,707 housing units at an average density of 27 per square mile (10/km²). The racial makeup of the county was 92.16% White, 5.22% Black or African American, 0.56% Native American, 0.44% Asian, 0.01% Pacific Islander, 0.26% from other races, and 1.36% from two or more races. Approximately 1.01% of the population were Hispanic or Latino of any race. Among the major first ancestries reported in Butler County were 31.7% American, 13.8% German, 11.6% Irish and 10.5% English.
There were 16,718 households out of which 29.70% had children under the age of 18 living with them, 52.50% were married couples living together, 11.60% had a female householder with no husband present, and 32.30% were non-families. 28.00% of all households were made up of individuals and 12.70% had someone living alone who was 65 years of age or older. The average household size was 2.39 and the average family size was 2.91.
In the county, the population was spread out with 24.20% under the age of 18, 8.40% from 18 to 24, 26.60% from 25 to 44, 24.10% from 45 to 64, and 16.70% who were 65 years of age or older. The median age was 39 years. For every 100 females there were 92.00 males. For every 100 females age 18 and over, there were 87.10 males.
The median income for a household in the county was $34,422, and the median income for a family was $42,713. Males had a median income of $27,449 versus $19,374 for females. The per capita income for the county was $20,282. About 14.00% of families and 18.60% of the population were below the poverty line, including 25.90% of those under age 18 and 16.90% of those age 65 or over.
Religion
According to the Association of Religion Data Archives County Membership Report (2010), most residents (58.00%) in Butler County do not adhere to a religion.
Among those who do adhere to a religion (42.00%), the majority of Butler County residents' religious affiliations are:
- 68.35% Evangelical Protestantism
- 11.92% Catholicism
- 11.25% Mainline Protestantism
- 5.41% Others (Mormonism, Islam, and Hinduism)
- 3.06% Black Protestantism
The main religious families among all adherents in Butler County are:
- 45.27% Baptists
- 14.64% Nondenominationals
- 11.92% Catholics
- 9.30% Pentecostals
- 6.67% Methodists
Education
Of adults 25 years of age and older in Butler County, 70.5% possesses a high school diploma or higher while 11.6% holds a bachelor's degree or higher as their highest educational attainment.
Public Schools
- Neelyville R-IV School District[11] - Neelyville
- Hillview Elementary School - Harviell - (PK-02)
- Neelyville Elementary School - (03-06)
- Neelyville High School - (07-12)
- Poplar Bluff R-I School District[12] - Poplar Bluff
- Eugene Field Elementary School - (01-03)
- Mark Twain Early Childhood Center - (PK/Daycare)
- Lake Road Elementary School - (01-04)
- Poplar Bluff Kindergarten Center - (K)
- O'Neal Elementary School - (01-03)
- Oak Grove Elementary School - (01-03)
- Poplar Bluff Middle School - (04-06)
- Poplar Bluff Jr. High School (07-08)
- Poplar Bluff High School (09-12)
- Twin Rivers R-X School District[13] - Broseley
Private schools
- Agape Christian School - Poplar Bluff - (K-12) - Non-denominational Christian
- Sacred Heart Elementary School[14] - Poplar Bluff - (PK-08) - Roman Catholic
- Southern Missouri Christian School - Poplar Bluff - (K-12) - Assembly of God/Pentecostal
- Westwood Baptist Academy[15] - Poplar Bluff - (PK-12) - Baptist
- Zion Lutheran School[16] - Poplar Bluff - Lutheran Church–Missouri Synod
Special education/other schools
- Hentz Alternative Learning Center - Poplar Bluff
- Shady Grove State School - Poplar Bluff
- Sierra-Osage Treatment Center - Poplar Bluff
- W.E. Sears Youth Center - Poplar Bluff
Post-secondary
- Three Rivers College - Poplar Bluff - A public, two-year community college.
Politics
Local
| Butler County, Missouri | ||||
|---|---|---|---|---|
| Elected countywide officials | ||||
| Assessor | Chris Rickman | Republican | ||
| Circuit Clerk | Cindi Bowman | Republican | ||
| County Clerk | Tonyi Deffendall | Republican | ||
| Collector | Emily Clark Parks | Republican | ||
| Commissioner (Presiding) |
Vince Lampe | Republican | ||
| Commissioner (District 1) |
Don Anderson | Republican | ||
| Commissioner (District 2) |
Dennis “Boots” LeGrand | Republican | ||
| Coroner | Andy Moore | Republican | ||
| Prosecuting Attorney | Kacey Proctor | Republican | ||
| Public Administrator | Sharron Payne | Republican | ||
| Recorder | Debby Lundstrom | Republican | ||
| Sheriff | Mark Dobbs | Republican | ||
| Surveyor | Jim Mathis | Republican | ||
| Treasurer | Tammy Marler | Republican | ||
The Republican Party completely controls all politics at the local level in Butler County.
State
Butler County is divided into two legislative districts in the Missouri House of Representatives:
- District 152 is currently represented by Hardy Billington (R-Poplar Bluff). It consists of all of the cities of Neelyville, Qulin, and Poplar Bluff; all of the census-designated place of Harviell; and the unincorporated communities of Angus, Batesville, Belcher, Booser, Broseley, Fagus, Hubbel, Kremlin, Loma Linda, Nyssa, Oglesville, Platanus, Resnik, Roxie, Taft, and Vastus.
| Party | Candidate | Votes | % | ± | |
|---|---|---|---|---|---|
| Republican | Todd Richardson | 9,807 | 100.00% | ||
| Party | Candidate | Votes | % | ± | |
|---|---|---|---|---|---|
| Republican | Todd Richardson | 4,646 | 100.00% | ||
| Party | Candidate | Votes | % | ± | |
|---|---|---|---|---|---|
| Republican | Todd Richardson | 9,569 | 100.00% | ||
- District 153 is currently represented by Jeff Shawan (R-Poplar Bluff). It consists of all of the city of Fisk and the unincorporated communities of Ash Hill, Barron, Empire, Halloran, Hamtown, Hendrickson, Hilliard, Keener, Kinzer, Morocco, Rombauer, and Wilby.
| Party | Candidate | Votes | % | ± | |
|---|---|---|---|---|---|
| Republican | Steve Cookson | 5,007 | 81.09% | -6.05 | |
| Democratic | Matt Michel | 1,168 | 18.91% | +18.91 | |
| Party | Candidate | Votes | % | ± | |
|---|---|---|---|---|---|
| Republican | Steve Cookson | 2,664 | 87.14% | +3.95 | |
| Libertarian | Ginny Keirns | 393 | 12.86% | +12.86 | |
| Party | Candidate | Votes | % | ± | |
|---|---|---|---|---|---|
| Republican | Steve Cookson | 4,652 | 83.19% | ||
| Independent | Jack (Skip) Johnson | 940 | 16.81% | ||
All of Butler County is included in Missouri's 25th Senatorial District and is represented by Republican Doug Libla (R-Poplar Bluff) in the Missouri Senate.
| Party | Candidate | Votes | % | ± | |
|---|---|---|---|---|---|
| Republican | Doug Libla | 12,741 | 76.16% | +6.54 | |
| Democratic | Bill Burlison | 3,989 | 23.84% | -6.54 | |
| Party | Candidate | Votes | % | ± | |
|---|---|---|---|---|---|
| Republican | Doug Libla | 11,518 | 69.62% | ||
| Democratic | Terry Swinger | 5,026 | 30.38% | ||
| Year | Republican | Democratic | Third Parties |
|---|---|---|---|
| 2016 | 73.78% 12,598 | 23.65% 4,039 | 2.57% 438 |
| 2012 | 55.46% 9,251 | 42.18% 7,036 | 2.36% 393 |
| 2008 | 54.12% 9,205 | 43.86% 7,459 | 2.02% 343 |
| 2004 | 66.12% 10,796 | 32.85% 5,364 | 1.03% 168 |
| 2000 | 58.40% 8,301 | 39.80% 5,657 | 1.80% 257 |
| 1996 | 47.71% 6,793 | 50.63% 7,208 | 1.66% 237 |
| 1992 | 49.18% 7,335 | 50.82% 7,581 | 0.00% 0 |
| 1988 | 66.86% 9,060 | 33.12% 4,488 | 0.02% 3 |
| 1984 | 59.67% 7,875 | 40.33% 5,323 | 0.00% 0 |
| 1980 | 53.17% 7,471 | 46.75% 6,569 | 0.07% 10 |
| 1976 | 52.91% 6,489 | 46.82% 5,742 | 0.27% 33 |
| 1972 | 54.67% 6,972 | 45.23% 5,768 | 0.09% 12 |
| 1968 | 41.44% 5,393 | 58.56% 7,621 | 0.00% 0 |
| 1964 | 38.67% 5,021 | 61.33% 7,964 | 0.00% 0 |
| 1960 | 49.56% 6,772 | 50.44% 6,891 | 0.00% 0 |
Federal
Butler County is represented in the U.S. Senate by U.S. Senators Josh Hawley (Republican) and Roy Blunt (Republican).
Butler County is included in Missouri's 8th Congressional District in the U.S. House of Representatives and is represented by Jason T. Smith (Republican).
Political culture
| Statewide Election Results | ||
|---|---|---|
| Year | Office | Results |
| 2012 | President | Romney 72.52% — 25.83% Obama |
| U.S. Senator | Akin 54.33% — 40.59% McCaskill | |
| Governor | Spence 55.46% — 42.18% Nixon | |
| Lt. Governor | Kinder 70.68% — 25.51% Montee | |
| Secretary of State | Schoeller 65.26% — 31.39% Kander | |
| State Treasurer | McNary 63.41% — 32.74% Zweifel | |
| Attorney General | Martin 56.67% — 39.59% Koster | |
| 2010 | U.S. Senator | Blunt 70.54% — 25.19% Carnahan |
| State Auditor | Schweich 69.06% — 27.20% Montee | |
| 2008 | President | McCain 68.09% — 30.66% Obama |
| Governor | Hulshof 54.12% — 43.86% Nixon | |
| Lt. Governor | Kinder 64.84% — 32.94% Page | |
| Secretary of State | Carnahan 50.10% — 47.50% Hubbard | |
| State Treasurer | Lager 62.53% — 35.17% Zweifel | |
| Attorney General | Gibbons 60.27% — 39.73% Koster | |
| 2006 | U.S. Senator | Talent 60.89% — 35.79% McCaskill |
| State Auditor | Thomas 57.27% — 38.93% Montee | |
| 2004 | President | Bush 71.14% — 28.38% Kerry |
| U.S. Senator | Bond 73.11% — 25.95% Farmer | |
| Governor | Blunt 66.12% — 32.85% McCaskill | |
| Lt. Governor | Kinder 63.00% — 33.96% Cook | |
| Secretary of State | Hanaway 60.51% — 36.84% Carnahan | |
| State Treasurer | Steelman 60.07% — 31.32% Powell | |
| Attorney General | Byrd 54.54% — 42.27% Nixon | |
| Year | Republican | Democratic | Third parties |
|---|---|---|---|
| 2016 | 79.1% 13,650 | 17.6% 3,036 | 3.3% 573 |
| 2012 | 72.5% 12,248 | 25.8% 4,363 | 1.7% 278 |
| 2008 | 68.1% 11,805 | 30.7% 5,316 | 1.3% 217 |
| 2004 | 71.1% 11,696 | 28.4% 4,666 | 0.5% 79 |
| 2000 | 63.3% 9,111 | 34.7% 4,996 | 2.0% 290 |
| 1996 | 48.8% 6,996 | 40.3% 5,780 | 10.9% 1,567 |
| 1992 | 42.2% 6,450 | 43.2% 6,602 | 14.5% 2,220 |
| 1988 | 58.0% 7,968 | 41.9% 5,751 | 0.1% 19 |
| 1984 | 65.0% 8,712 | 35.0% 4,699 | |
| 1980 | 58.8% 8,342 | 39.5% 5,605 | 1.7% 234 |
| 1976 | 45.4% 5,669 | 54.1% 6,759 | 0.5% 57 |
| 1972 | 72.6% 9,198 | 27.4% 3,466 | |
| 1968 | 47.0% 6,326 | 32.5% 4,379 | 20.5% 2,759 |
| 1964 | 42.1% 5,616 | 57.9% 7,710 | |
| 1960 | 61.8% 8,751 | 38.2% 5,406 | |
| 1956 | 55.2% 7,216 | 44.9% 5,869 | |
| 1952 | 54.9% 7,843 | 45.0% 6,426 | 0.1% 16 |
| 1948 | 44.4% 4,276 | 55.2% 5,319 | 0.4% 35 |
| 1944 | 60.0% 6,375 | 39.7% 4,219 | 0.3% 32 |
| 1940 | 56.2% 8,024 | 43.5% 6,213 | 0.3% 38 |
| 1936 | 50.3% 6,355 | 49.4% 6,234 | 0.3% 42 |
| 1932 | 40.3% 4,155 | 58.8% 6,058 | 0.9% 90 |
| 1928 | 62.5% 5,591 | 37.1% 3,320 | 0.4% 38 |
| 1924 | 56.0% 4,489 | 36.8% 2,953 | 7.2% 577 |
| 1920 | 61.8% 4,601 | 35.8% 2,662 | 2.4% 179 |
| 1916 | 53.8% 2,717 | 42.2% 2,135 | 4.0% 202 |
| 1912 | 39.7% 1,851 | 41.7% 1,946 | 18.6% 868 |
| 1908 | 51.2% 2,186 | 44.4% 1,893 | 4.4% 189 |
| 1904 | 54.9% 1,960 | 38.4% 1,369 | 6.7% 239 |
| 1900 | 51.8% 1,888 | 45.8% 1,670 | 2.4% 89 |
| 1896 | 48.2% 1,635 | 51.4% 1,743 | 0.4% 15 |
| 1892 | 42.3% 1,052 | 49.6% 1,233 | 8.1% 202 |
| 1888 | 41.0% 857 | 56.9% 1,189 | 2.1% 43 |
Missouri presidential preference primary (2008)
Voters in Butler County from both political parties supported candidates who finished in second place in the state at large and nationally.
- Hillary Rodham Clinton received more votes, a total of 2,490, than any candidate from either party in Butler County during the 2008 Missouri presidential preference primary.
| Butler County, Missouri | |
|---|---|
| 2008 Republican primary in Missouri | |
| John McCain | 1,117 (24.64%) |
| Mike Huckabee | 2,215 (48.85%) |
| Mitt Romney | 1,007 (22.21%) |
| Ron Paul | 134 (2.96%) |
| Butler County, Missouri | |
|---|---|
| 2008 Democratic primary in Missouri | |
| Hillary Clinton | 2,490 (69.87%) |
| Barack Obama | 960 (26.94%) |
| John Edwards (withdrawn) | 82 (2.30%) |
Communities
Cities
- Fisk
- Neelyville
- Poplar Bluff (county seat)
- Qulin
Census-designated places
- Fairdealing (part)
- Harviell
Other unincorporated communities
Townships
Butler County is divided into ten townships:
References
- "State & County QuickFacts". United States Census Bureau. Retrieved September 7, 2013.
- "Find a County". National Association of Counties. Archived from the original on 2011-05-31. Retrieved 2011-06-07.
- Eaton, David Wolfe (1916). How Missouri Counties, Towns and Streams Were Named. The State Historical Society of Missouri. pp. 264.
- "2010 Census Gazetteer Files". United States Census Bureau. August 22, 2012. Archived from the original on October 21, 2013. Retrieved November 13, 2014.
- "Population and Housing Unit Estimates". Retrieved November 29, 2019.
- "U.S. Decennial Census". United States Census Bureau. Retrieved November 13, 2014.
- "Historical Census Browser". University of Virginia Library. Retrieved November 13, 2014.
- "Population of Counties by Decennial Census: 1900 to 1990". United States Census Bureau. Retrieved November 13, 2014.
- "Census 2000 PHC-T-4. Ranking Tables for Counties: 1990 and 2000" (PDF). United States Census Bureau. Retrieved November 13, 2014.
- "U.S. Census website". United States Census Bureau. Retrieved 2011-05-14.
- "Archived copy". Archived from the original on 2008-06-21. Retrieved 2009-01-28.CS1 maint: archived copy as title (link)
- "Poplar Bluff Public Schools".
- "Archived copy". Archived from the original on 2009-02-26. Retrieved 2009-01-28.CS1 maint: archived copy as title (link)
- "Archived copy". Archived from the original on 2008-03-18. Retrieved 2009-01-28.CS1 maint: archived copy as title (link)
- "Welcome!". Westwood Baptist Church. Retrieved 2018-03-24.
- "Archived copy". Archived from the original on 2005-11-18. Retrieved 2009-01-28.CS1 maint: archived copy as title (link)
- Breeding, Marshall. "Fisk Community Library". Libraries.org. Retrieved May 8, 2017.
- Breeding, Marshall. "Poplar Bluff Public Library". Libraries.org. Retrieved May 8, 2017.
- Leip, David. "Dave Leip's Atlas of U.S. Presidential Elections". uselectionatlas.org. Retrieved 2018-03-24.
External links
- Digitized 1930 Plat Book of Butler County from University of Missouri Division of Special Collections, Archives, and Rare Books
Places adjacent to Butler County, Missouri | ||||||||||
|---|---|---|---|---|---|---|---|---|---|---|
| ||||||||||
Municipalities and communities of Butler County, Missouri, United States | ||
|---|---|---|
| Cities | Map of Missouri highlighting Butler County | |
| Townships | ||
| CDP | ||
| Other unincorporated communities | ||
| Ghost town | ||
| Footnotes | ‡This populated place also has portions in an adjacent county or counties | |
| Authority control |
|
|---|