Phillips County, Colorado
| Phillips County, Colorado | ||
|---|---|---|
 | ||
| ||
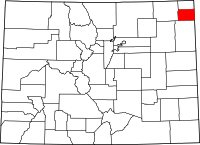 Location in the U.S. state of Colorado | ||
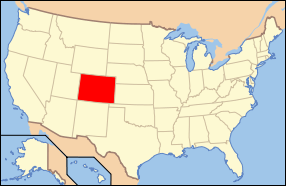 Colorado's location in the U.S. | ||
| Founded | March 27, 1889 | |
| Named for | R.O. Phillips | |
| Seat | Holyoke | |
| Largest city | Holyoke | |
| Area | ||
| • Total | 688 sq mi (1,782 km2) | |
| • Land | 688 sq mi (1,782 km2) | |
| • Water | 0.1 sq mi (0 km2), 0.02% | |
| Population (est.) | ||
| • (2015) | 4,349 | |
| • Density | 6.5/sq mi (2.5/km2) | |
| Congressional district | 4th | |
| Time zone | Mountain: UTC−7/−6 | |
| Website |
www | |

Phillips County is one of the 64 counties in the U.S. state of Colorado. As of the 2010 census, the population was 4,442.[1] The county seat is Holyoke.[2] The county was named in honor of R.O. Phillips, a secretary of the Lincoln Land Company, who organized several towns in Colorado.
Geography

According to the U.S. Census Bureau, the county has a total area of 688 square miles (1,780 km2), of which 688 square miles (1,780 km2) is land and 0.1 square miles (0.26 km2) (0.02%) is water.[3]
Adjacent counties
- Sedgwick County - north
- Perkins County, Nebraska - northeast
- Chase County, Nebraska - east
- Yuma County - south
- Logan County - west
Demographics
| Historical population | |||
|---|---|---|---|
| Census | Pop. | %± | |
| 1890 | 2,642 | — | |
| 1900 | 1,583 | −40.1% | |
| 1910 | 3,179 | 100.8% | |
| 1920 | 5,499 | 73.0% | |
| 1930 | 5,797 | 5.4% | |
| 1940 | 4,948 | −14.6% | |
| 1950 | 4,924 | −0.5% | |
| 1960 | 4,440 | −9.8% | |
| 1970 | 4,131 | −7.0% | |
| 1980 | 4,542 | 9.9% | |
| 1990 | 4,189 | −7.8% | |
| 2000 | 4,480 | 6.9% | |
| 2010 | 4,442 | −0.8% | |
| Est. 2016 | 4,288 | [4] | −3.5% |
| U.S. Decennial Census[5] 1790-1960[6] 1900-1990[7] 1990-2000[8] 2010-2015[1] | |||
As of the census[9] of 2000, there were 4,480 people, 1,781 households, and 1,239 families residing in the county. The population density was 6 people per square mile (3/km²). There were 2,014 housing units at an average density of 3 per square mile (1/km²). The racial makeup of the county was 93.04% White, 0.20% Black or African American, 0.29% Native American, 0.40% Asian, 0.02% Pacific Islander, 4.71% from other races, and 1.34% from two or more races. 11.76% of the population were Hispanic or Latino of any race.
There were 1,781 households out of which 32.90% had children under the age of 18 living with them, 61.20% were married couples living together, 5.60% had a female householder with no husband present, and 30.40% were non-families. 27.50% of all households were made up of individuals and 14.30% had someone living alone who was 65 years of age or older. The average household size was 2.47 and the average family size was 3.01.
In the county, the population was spread out with 26.90% under the age of 18, 6.30% from 18 to 24, 25.30% from 25 to 44, 22.20% from 45 to 64, and 19.40% who were 65 years of age or older. The median age was 40 years. For every 100 females there were 93.40 males. For every 100 females age 18 and over, there were 90.50 males.
The median income for a household in the county was $32,177, and the median income for a family was $38,144. Males had a median income of $30,095 versus $18,682 for females. The per capita income for the county was $16,394. About 8.80% of families and 11.60% of the population were below the poverty line, including 14.70% of those under age 18 and 7.20% of those age 65 or over.
Politics
| Year | Republican | Democratic | Others |
|---|---|---|---|
| 2016 | 76.8% 1,791 | 18.7% 436 | 4.5% 105 |
| 2012 | 72.3% 1,637 | 26.0% 588 | 1.8% 40 |
| 2008 | 71.3% 1,613 | 27.5% 622 | 1.2% 26 |
| 2004 | 73.9% 1,717 | 25.0% 582 | 1.1% 26 |
| 2000 | 70.9% 1,573 | 25.4% 564 | 3.7% 83 |
| 1996 | 58.8% 1,284 | 32.3% 706 | 8.9% 195 |
| 1992 | 46.7% 1,075 | 30.1% 692 | 23.3% 536 |
| 1988 | 57.8% 1,317 | 40.5% 923 | 1.7% 38 |
| 1984 | 71.4% 1,689 | 27.5% 651 | 1.1% 27 |
| 1980 | 63.2% 1,488 | 27.2% 640 | 9.6% 226 |
| 1976 | 48.1% 1,142 | 49.4% 1,173 | 2.4% 58 |
| 1972 | 65.3% 1,480 | 30.3% 687 | 4.4% 99 |
| 1968 | 56.9% 1,237 | 33.2% 723 | 9.9% 215 |
| 1964 | 44.8% 1,012 | 55.0% 1,243 | 0.2% 5 |
| 1960 | 62.8% 1,455 | 37.2% 862 | 0.0% 1 |
| 1956 | 63.4% 1,535 | 36.6% 887 | 0.0% 1 |
| 1952 | 67.7% 1,670 | 32.0% 789 | 0.3% 7 |
| 1948 | 52.5% 1,076 | 45.5% 932 | 2.0% 41 |
| 1944 | 65.2% 1,455 | 34.1% 761 | 0.8% 17 |
| 1940 | 54.3% 1,168 | 42.7% 919 | 3.0% 64 |
| 1936 | 36.2% 941 | 61.5% 1,602 | 2.3% 60 |
| 1932 | 34.8% 903 | 56.1% 1,453 | 9.1% 236 |
| 1928 | 65.2% 1,440 | 31.9% 705 | 2.9% 65 |
| 1924 | 49.6% 1,076 | 18.3% 397 | 32.1% 696 |
| 1920 | 66.8% 1,191 | 26.9% 480 | 6.3% 112 |
| 1916 | 38.2% 532 | 57.0% 795 | 4.8% 67 |
| 1912 | 22.4% 266 | 37.7% 448 | 40.0% 475 |
Communities
City
Towns
Census-designated place
See also
References
- 1 2 "State & County QuickFacts". United States Census Bureau. Archived from the original on July 16, 2011. Retrieved February 11, 2014.
- ↑ "Find a County". National Association of Counties. Retrieved 2011-06-07.
- ↑ "US Gazetteer files: 2010, 2000, and 1990". United States Census Bureau. 2011-02-12. Retrieved 2011-04-23.
- ↑ "Population and Housing Unit Estimates". Retrieved June 9, 2017.
- ↑ "U.S. Decennial Census". United States Census Bureau. Retrieved June 10, 2014.
- ↑ "Historical Census Browser". University of Virginia Library. Retrieved June 10, 2014.
- ↑ "Population of Counties by Decennial Census: 1900 to 1990". United States Census Bureau. Retrieved June 10, 2014.
- ↑ "Census 2000 PHC-T-4. Ranking Tables for Counties: 1990 and 2000" (PDF). United States Census Bureau. Retrieved June 10, 2014.
- ↑ "American FactFinder". United States Census Bureau. Retrieved 2011-05-14.
- ↑ Leip, David. "Dave Leip's Atlas of U.S. Presidential Elections". uselectionatlas.org. Retrieved May 26, 2017.
External links
- Phillips County Government
- Phillips County Economic Development Corporation website
- Colorado County Evolution by Don Stanwyck
- Colorado Historical Society
Places adjacent to Phillips County, Colorado | ||||||||||
|---|---|---|---|---|---|---|---|---|---|---|
| ||||||||||
Municipalities and communities of Phillips County, Colorado, United States | ||
|---|---|---|
| City | | |
| Towns | ||
| CDP | ||