San Miguel County, Colorado
| San Miguel County, Colorado | |
|---|---|
 The San Miguel County Courthouse | |
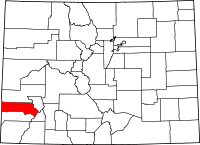 Location in the U.S. state of Colorado | |
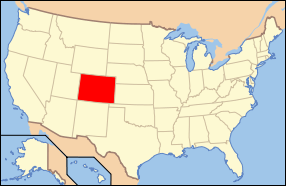 Colorado's location in the U.S. | |
| Founded | March 2, 1883 |
| Named for | San Miguel River |
| Seat | Telluride |
| Largest town | Telluride |
| Area | |
| • Total | 1,289 sq mi (3,338 km2) |
| • Land | 1,287 sq mi (3,333 km2) |
| • Water | 2.0 sq mi (5 km2), 0.2% |
| Population (est.) | |
| • (2015) | 7,879 |
| • Density | 5.7/sq mi (2.2/km2) |
| Congressional district | 3rd |
| Time zone | Mountain: UTC−7/−6 |
| Website |
www |
San Miguel County is one of the 64 counties of the U.S. state of Colorado. As of the 2010 census, the population was 7,359.[1] The county seat is Telluride.[2] The county is named for the San Miguel River.
History
San Miguel County was given the Spanish language name for "Saint Michael" due to the nearby San Miguel River. On 27 February 1883, Ouray County was split to form San Miguel County. Originally the San Miguel County portion was to retain the name Ouray County with the new portion called Uncompahgre County.
Mining operators in the San Juan mountain area of Colorado formed the San Juan District Mining Association (SJDMA) in 1903, as a direct result of a Western Federation of Miners proposal to the Telluride Mining Association for the eight-hour day, which had been approved in a referendum by 72 percent of Colorado voters.[3] The new association consolidated the power of thirty-six mining properties in San Miguel, Ouray, and San Juan counties.[4] The SJDMA refused to consider any reduction in hours or increase in wages, helping to provoke a bitter strike.
In 1875, the Smuggler gold vein was discovered near Telluride. The Smuggler-Union, Tomboy, and Liberty Bell mines combined produced over a hundred tons of gold by 1920, third in the state of Colorado.[5]:51,83
Geography
According to the U.S. Census Bureau, the county has a total area of 1,289 square miles (3,340 km2), of which 1,287 square miles (3,330 km2) is land and 2.0 square miles (5.2 km2) (0.2%) is water.[6]
Adjacent counties
- Montrose County - north
- Ouray County - east
- San Juan County - southeast
- Dolores County - south
- San Juan County, Utah - west
National protected areas
Trails and byways
- Great Parks Bicycle Route
- San Juan Skyway National Scenic Byway
- Unaweep/Tabeguache Scenic and Historic Byway
- Western Express Bicycle Route
Demographics
| Historical population | |||
|---|---|---|---|
| Census | Pop. | %± | |
| 1890 | 2,909 | — | |
| 1900 | 5,379 | 84.9% | |
| 1910 | 4,700 | −12.6% | |
| 1920 | 5,281 | 12.4% | |
| 1930 | 2,184 | −58.6% | |
| 1940 | 3,664 | 67.8% | |
| 1950 | 2,693 | −26.5% | |
| 1960 | 2,944 | 9.3% | |
| 1970 | 1,949 | −33.8% | |
| 1980 | 3,192 | 63.8% | |
| 1990 | 3,653 | 14.4% | |
| 2000 | 6,594 | 80.5% | |
| 2010 | 7,359 | 11.6% | |
| Est. 2016 | 8,017 | [7] | 8.9% |
| U.S. Decennial Census[8] 1790-1960[9] 1900-1990[10] 1990-2000[11] 2010-2015[1] | |||
As of the census[12] of 2000, there were 6,594 people, 3,015 households, and 1,423 families residing in the county. The population density was 5 people per square mile (2/km²). There were 5,197 housing units at an average density of 4 per square mile (2/km²). The racial makeup of the county was 93.57% White, 0.29% Black or African American, 0.85% Native American, 0.74% Asian, 0.08% Pacific Islander, 3.37% from other races, and 1.11% from two or more races. 8.6% of the population were Hispanic or Latino of any race.
There were 3,015 households out of which 22.80% had children under the age of 18 living with them, 38.30% were married couples living together, 5.40% had a female householder with no husband present, and 52.80% were non-families. 32.70% of all households were made up of individuals and 2.50% had someone living alone who was 65 years of age or older. The average household size was 2.18 and the average family size was 2.77.
In the county, the population was spread out with 17.60% under the age of 18, 9.90% from 18 to 24, 43.30% from 25 to 44, 25.80% from 45 to 64, and 3.40% who were 65 years of age or older. The median age was 34 years. For every 100 females there were 120.80 males. For every 100 females age eighteen 18 and over, there were 126.40 males.
The median income for a household in the county was $48,514, and the median income for a family was $60,417. Males had a median income of $35,922 versus $30,278 for females. The per capita income for the county was $35,329. About 6.60% of families and 10.40% of the population were below the poverty line, including 11.10% of those under age 18 and 8.00% of those age 65 or over.
Politics
| Year | Republican | Democratic | Others |
|---|---|---|---|
| 2016 | 23.9% 1,033 | 68.7% 2,975 | 7.4% 321 |
| 2012 | 27.1% 1,154 | 70.3% 2,992 | 2.6% 110 |
| 2008 | 21.5% 933 | 77.0% 3,349 | 1.6% 68 |
| 2004 | 26.9% 1,079 | 71.6% 2,876 | 1.6% 64 |
| 2000 | 32.0% 1,043 | 49.1% 1,598 | 18.9% 614 |
| 1996 | 28.2% 773 | 56.0% 1,535 | 15.9% 435 |
| 1992 | 23.6% 628 | 51.8% 1,380 | 24.6% 655 |
| 1988 | 43.4% 798 | 52.3% 961 | 4.4% 80 |
| 1984 | 54.8% 833 | 43.0% 654 | 2.2% 34 |
| 1980 | 42.8% 774 | 36.0% 651 | 21.2% 384 |
| 1976 | 43.8% 622 | 47.5% 674 | 8.7% 123 |
| 1972 | 55.0% 583 | 40.2% 426 | 4.9% 52 |
| 1968 | 53.2% 422 | 39.2% 311 | 7.6% 60 |
| 1964 | 34.2% 332 | 65.6% 636 | 0.2% 2 |
| 1960 | 46.1% 525 | 53.7% 612 | 0.2% 2 |
| 1956 | 57.9% 648 | 41.9% 469 | 0.3% 3 |
| 1952 | 55.2% 654 | 44.2% 524 | 0.6% 7 |
| 1948 | 41.8% 451 | 56.8% 613 | 1.4% 15 |
| 1944 | 45.7% 536 | 53.7% 630 | 0.6% 7 |
| 1940 | 45.9% 729 | 53.6% 851 | 0.4% 7 |
| 1936 | 32.1% 433 | 63.8% 860 | 4.1% 55 |
| 1932 | 29.7% 383 | 66.9% 862 | 3.3% 43 |
| 1928 | 54.9% 721 | 42.2% 554 | 2.9% 38 |
| 1924 | 43.6% 677 | 36.5% 567 | 19.9% 308 |
| 1920 | 54.3% 928 | 40.3% 688 | 5.4% 93 |
| 1916 | 29.1% 578 | 66.8% 1,325 | 4.1% 81 |
| 1912 | 30.4% 639 | 48.9% 1,029 | 20.8% 437 |
Communities
- Mountain Village
- Norwood
- Ophir
- Placerville
- Sawpit
- Telluride
- Tomboy (ghost town)
See also
References
- 1 2 "State & County QuickFacts". United States Census Bureau. Retrieved June 11, 2014.
- ↑ "Find a County". National Association of Counties. Retrieved 2011-06-07.
- ↑ Roughneck—The Life and Times of Big Bill Haywood, Peter Carlson, 1983, page 65.
- ↑ The Corpse On Boomerang Road, Telluride's War On Labor 1899-1908, MaryJoy Martin, 2004, page 201.
- ↑ Voynick, S.M., 1992, Colorado Gold, Missoula: Mountain Press Publishing Company, ISBN 0878424555
- ↑ "US Gazetteer files: 2010, 2000, and 1990". United States Census Bureau. 2011-02-12. Retrieved 2011-04-23.
- ↑ "Population and Housing Unit Estimates". Retrieved June 9, 2017.
- ↑ "U.S. Decennial Census". United States Census Bureau. Retrieved June 11, 2014.
- ↑ "Historical Census Browser". University of Virginia Library. Retrieved June 11, 2014.
- ↑ "Population of Counties by Decennial Census: 1900 to 1990". United States Census Bureau. Retrieved June 11, 2014.
- ↑ "Census 2000 PHC-T-4. Ranking Tables for Counties: 1990 and 2000" (PDF). United States Census Bureau. Retrieved June 11, 2014.
- ↑ "American FactFinder". United States Census Bureau. Retrieved 2011-05-14.
- ↑ Leip, David. "Dave Leip's Atlas of U.S. Presidential Elections". uselectionatlas.org. Retrieved May 26, 2017.
External links
- San Miguel County Government website
- Colorado County Evolution by Don Stanwyck
- Colorado Historical Society
Places adjacent to San Miguel County, Colorado | ||||||||||
|---|---|---|---|---|---|---|---|---|---|---|
| ||||||||||
Municipalities and communities of San Miguel County, Colorado, United States | ||
|---|---|---|
| Towns | | |
| Unincorporated communities | ||
| Ghost town | ||