Pitkin County, Colorado
| Pitkin County, Colorado | |
|---|---|
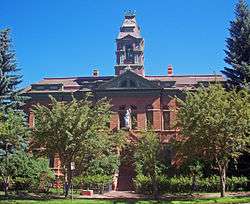 Pitkin County Courthouse | |
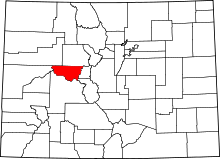 Location in the U.S. state of Colorado | |
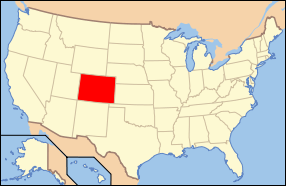 Colorado's location in the U.S. | |
| Founded | February 23, 1881 |
| Named for | Frederick Walker Pitkin |
| Seat | Aspen |
| Largest city | Aspen |
| Area | |
| • Total | 973 sq mi (2,520 km2) |
| • Land | 971 sq mi (2,515 km2) |
| • Water | 2.5 sq mi (6 km2), 0.3% |
| Population (est.) | |
| • (2015) | 17,787 |
| • Density | 18/sq mi (7/km2) |
| Congressional district | 3rd |
| Time zone | Mountain: UTC−7/−6 |
| Website |
www |
Pitkin County is one of the 64 counties in the U.S. state of Colorado. As of the 2010 census, the population was 17,148.[1] The county seat is Aspen.[2] The county is named in honor of the late Colorado Governor Frederick Walker Pitkin. Pitkin County has the seventh-highest per capita income of any county in the United States.[3]
Pitkin County is included in the Glenwood Springs, CO Micropolitan Statistical Area, which is also included in the Edwards-Glenwood Springs, CO Combined Statistical Area.
Geography
According to the U.S. Census Bureau, the county has a total area of 973 square miles (2,520 km2), of which 971 sq mi (2,510 km2) is land and 2.5 sq mi (6.5 km2) (0.3%) is water.[4] The high point of the county is Castle Peak, a fourteener with a height of 14,265 feet (4,348 m). It is located 20 miles (32 km) south of Aspen on the Gunnison County border.
Adjacent counties
- Eagle County – northeast
- Lake County – east
- Chaffee County – southeast
- Gunnison County – south
- Mesa County – west
- Garfield County – northwest
Major highways
National protected areas
Trails and byways
Demographics
| Historical population | |||
|---|---|---|---|
| Census | Pop. | %± | |
| 1890 | 8,929 | — | |
| 1900 | 7,020 | −21.4% | |
| 1910 | 4,566 | −35.0% | |
| 1920 | 2,707 | −40.7% | |
| 1930 | 1,770 | −34.6% | |
| 1940 | 1,836 | 3.7% | |
| 1950 | 1,643 | −10.5% | |
| 1960 | 2,381 | 44.9% | |
| 1970 | 6,185 | 159.8% | |
| 1980 | 10,338 | 67.1% | |
| 1990 | 12,661 | 22.5% | |
| 2000 | 14,872 | 17.5% | |
| 2010 | 17,148 | 15.3% | |
| Est. 2016 | 17,752 | [5] | 3.5% |
| U.S. Decennial Census[6] 1790-1960[7] 1900-1990[8] 1990-2000[9] 2010-2015[1] | |||
As of the census[10] of 2000, there were 14,872 people, 6,807 households, and 3,185 families residing in the county. The population density was 15 people per square mile (6/km²). There were 10,096 housing units at an average density of 10 per square mile (4/km²). The racial makeup of the county was 94.33% White, 0.53% Black or African American, 0.27% Native American, 1.12% Asian, 0.04% Pacific Islander, 2.37% from other races, and 1.34% from two or more races. Of the population, 6.54% were Hispanic or Latino of any race.
There were 6,807 households out of which 21.10% had children under the age of 18 living with them, 38.70% were married couples living together, 5.30% had a female householder with no husband present, and 53.20% were non-families. Of all households, 35.80% were made up of individuals and 3.50% had someone living alone who was 65 years of age or older. The average household size was 2.14 and the average family size was 2.77.
In the county, the population was spread out with 16.70% under the age of 18, 7.70% from 18 to 24, 38.30% from 25 to 44, 30.50% from 45 to 64, and 6.80% who were 65 years of age or older. The median age was 38 years. For every 100 females there were 115.10 males. For every 100 females age 18 and over, there were 117.40 males.
The median income for a household in the county was $59,375, and the median income for a family was $75,048. Males had a median income of $40,672 versus $33,896 for females. The per capita income for the county was $40,811. About 3.00% of families and 6.20% of the population were below the poverty line, including 4.40% of those under age 18 and 5.60% of those age 65 or over.
Life expectancy
According to a report in the Journal of the American Medical Association, residents of Pitkin County had a 2014 life expectancy of 86.52 years, the second longest in the United States.[11] Both men and women live longer in Pitkin County than nearly every other county in the United States. 85.2 years for men and 88.0 years for women is the life expectancy at birth.[12] Two contiguous counties, Summit and Eagle counties, rank numbers one and three in the nation in life expectancy.
Factors contributing to the high life expectancy in Pitkin County are "high education, high income, high access to medical care, the people are physically active, obesity is lower than anywhere else — so you’re doing it right.” said Dr. Ali Mokdad, one of the study’s co-authors.[13]
Communities
City
Towns
Census-designated places
Other unincorporated places
Politics
In its early history Pitkin County favored the Democratic Party, for whom it voted in every election between 1896 and 1916, being among the few Western counties to support Alton B. Parker in 1904. After that, it followed the trends of the nation until being narrowly carried by losing candidate Thomas E. Dewey in 1944. Pitkin subsequently remained Republican-leaning until the growing ski resort community drew its residents to the liberal George McGovern – rejected by a majority of the electorates of all but 129 other counties – in 1972. Since the 1980s, Pitkin has turned powerfully Democratic due to the threat posed by over-development, plus the need for affordable housing and alternative mobility solutions. The last Republican to carry the county was Ronald Reagan in 1984, and George H. W. Bush in the following election is the last Republican to gain a third of the county’s vote.
In this modern era, Pitkin has also frequently been one of the leading counties for leftist third-party candidates, being the fourth-best county for Eugene McCarthy in 1976,[14] and the third-best for John B. Anderson in 1980.[15]
| Year | Republican | Democratic | Others |
|---|---|---|---|
| 2016 | 24.2% 2,550 | 69.7% 7,333 | 6.1% 640 |
| 2012 | 30.0% 3,024 | 68.0% 6,849 | 2.0% 202 |
| 2008 | 24.9% 2,484 | 73.7% 7,349 | 1.3% 133 |
| 2004 | 30.1% 2,784 | 68.4% 6,335 | 1.5% 137 |
| 2000 | 32.9% 2,565 | 53.0% 4,137 | 14.1% 1,098 |
| 1996 | 28.2% 1,969 | 56.5% 3,949 | 15.3% 1,067 |
| 1992 | 22.6% 1,686 | 51.1% 3,820 | 26.3% 1,963 |
| 1988 | 44.3% 2,801 | 54.1% 3,420 | 1.7% 105 |
| 1984 | 56.4% 3,117 | 41.5% 2,293 | 2.1% 118 |
| 1980 | 39.8% 2,153 | 32.5% 1,760 | 27.8% 1,504 |
| 1976 | 53.6% 2,955 | 39.8% 2,194 | 6.6% 363 |
| 1972 | 44.2% 2,064 | 54.2% 2,531 | 1.7% 79 |
| 1968 | 56.2% 1,135 | 36.0% 728 | 7.8% 158 |
| 1964 | 35.9% 540 | 63.7% 958 | 0.4% 6 |
| 1960 | 58.2% 679 | 41.8% 488 | 0.0% 0 |
| 1956 | 62.2% 550 | 37.7% 334 | 0.1% 1 |
| 1952 | 64.1% 556 | 35.6% 309 | 0.2% 2 |
| 1948 | 42.5% 319 | 54.5% 409 | 3.1% 23 |
| 1944 | 50.8% 368 | 49.0% 355 | 0.1% 1 |
| 1940 | 48.5% 484 | 50.4% 503 | 1.1% 11 |
| 1936 | 30.0% 305 | 64.8% 659 | 5.2% 53 |
| 1932 | 23.6% 239 | 71.8% 727 | 4.5% 46 |
| 1928 | 51.0% 485 | 47.7% 454 | 1.4% 13 |
| 1924 | 47.3% 442 | 21.8% 204 | 30.9% 289 |
| 1920 | 49.4% 478 | 43.1% 417 | 7.5% 73 |
| 1916 | 20.5% 263 | 71.3% 915 | 8.2% 105 |
| 1912 | 15.5% 208 | 57.5% 770 | 27.0% 361 |
See also
References
- 1 2 "State & County QuickFacts". United States Census Bureau. Retrieved February 11, 2014.
- ↑ "Find a County". National Association of Counties. Archived from the original on May 31, 2011. Retrieved 2011-06-07.
- ↑ "America's Richest States". Fox Business. September 16, 2011. Retrieved April 21, 2017.
- ↑ "US Gazetteer files: 2010, 2000, and 1990". United States Census Bureau. 2011-02-12. Retrieved 2011-04-23.
- ↑ "Population and Housing Unit Estimates". Retrieved June 9, 2017.
- ↑ "U.S. Decennial Census". United States Census Bureau. Archived from the original on May 12, 2015. Retrieved June 10, 2014.
- ↑ "Historical Census Browser". University of Virginia Library. Retrieved June 10, 2014.
- ↑ "Population of Counties by Decennial Census: 1900 to 1990". United States Census Bureau. Retrieved June 10, 2014.
- ↑ "Census 2000 PHC-T-4. Ranking Tables for Counties: 1990 and 2000" (PDF). United States Census Bureau. Retrieved June 10, 2014.
- ↑ "American FactFinder". United States Census Bureau. Retrieved 2011-05-14.
- ↑ Dwyer-Lindgren, Laura (8 May 2017). "Inequalities in Life Expectancy Among US Counties, 1980 to 2014". Journal of the American Medical Association: Internal Medicine. doi:10.1001/jamainternmed.2017.0918. Retrieved 9 May 2017.
- ↑ "County Profile: Pitkin County Colorado," http://www.healthdata.org/sites/default/files/files/county_profiles/US/2015/County_Report_Pitkin_County_Colorado.pdf, accessed 2 Aug 2017
- ↑ Achenbach, Joel, "U.S. life expectancy varies more than 20 years from county to county," Washington Post, May 8, 2017
- ↑ Dave Leip’s U.S. Election Atlas; 1976 Presidential Election Statistics
- ↑ Dave Leip’s U.S. Election Atlas; 1980 Presidential Election Statistics
- ↑ Leip, David. "Dave Leip's Atlas of U.S. Presidential Elections". uselectionatlas.org. Retrieved May 26, 2017.
External links
- Pitkin County Government website
- Colorado County Evolution by Don Stanwyck
- Colorado Historical Society
Places adjacent to Pitkin County, Colorado | ||||||||||
|---|---|---|---|---|---|---|---|---|---|---|
| ||||||||||
Municipalities and communities of Pitkin County, Colorado, United States | ||
|---|---|---|
| City | | |
| Towns | ||
| CDPs | ||
| Unincorporated communities | ||
| Ghost towns | ||
| Footnotes | ‡This populated place also has portions in an adjacent county or counties | |