Prowers County, Colorado
| Prowers County, Colorado | |
|---|---|
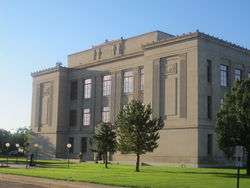 Prowers County Courthouse in Lamar | |
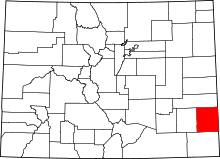 Location in the U.S. state of Colorado | |
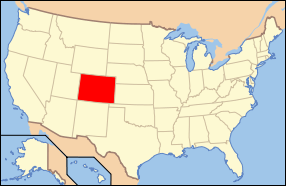 Colorado's location in the U.S. | |
| Founded | April 11, 1889 |
| Named for | John W. Prowers |
| Seat | Lamar |
| Largest city | Lamar |
| Area | |
| • Total | 1,644 sq mi (4,258 km2) |
| • Land | 1,638 sq mi (4,242 km2) |
| • Water | 5.9 sq mi (15 km2), 0.4% |
| Population (est.) | |
| • (2015) | 11,954 |
| • Density | 7.7/sq mi (3.0/km2) |
| Congressional district | 4th |
| Time zone | Mountain: UTC−7/−6 |
| Website |
www |
Prowers County is one of the 64 counties in the U.S. state of Colorado. As of the 2010 census, the population was 12,551.[1] The county seat is Lamar.[2] The county is named in honor of John W. Prowers, a leading pioneer in the lower Arkansas valley region.
Geography
According to the U.S. Census Bureau, the county has a total area of 1,644 square miles (4,260 km2), of which 1,638 square miles (4,240 km2) is land and 5.9 square miles (15 km2) (0.4%) is water.[3]
Adjacent counties
- Kiowa County (north)
- Greeley County, Kansas (northeast)
- Hamilton County, Kansas (east)
- Stanton County, Kansas (southeast/Central Time border)
- Baca County (south)
- Bent County (west)
Trails and byways
Antipode
Prowers County is home of the Antipode of the Indian Ocean island of Île Amsterdam and that island's settlement, La Roche Godon, making it one of the few places in the continental United States with a non-oceanic antipode.[4][5] The center of Ile Amsterdam is at 37.8332° S, 77.5505° E; the antipode, 37.8332° N and 102.4495° W is about 10 miles southeast of Lamar.
Demographics
| Historical population | |||
|---|---|---|---|
| Census | Pop. | %± | |
| 1890 | 1,969 | — | |
| 1900 | 3,766 | 91.3% | |
| 1910 | 9,520 | 152.8% | |
| 1920 | 13,845 | 45.4% | |
| 1930 | 14,762 | 6.6% | |
| 1940 | 12,304 | −16.7% | |
| 1950 | 14,836 | 20.6% | |
| 1960 | 13,296 | −10.4% | |
| 1970 | 13,258 | −0.3% | |
| 1980 | 13,070 | −1.4% | |
| 1990 | 13,347 | 2.1% | |
| 2000 | 14,483 | 8.5% | |
| 2010 | 12,551 | −13.3% | |
| Est. 2016 | 11,922 | [6] | −5.0% |
| U.S. Decennial Census[7] 1790-1960[8] 1900-1990[9] 1990-2000[10] 2010-2015[1] | |||
As of the census[11] of 2010, there were 12,551 people, 4,935 households, and 3,351 families residing in the county. The population density was 7.6 people per square mile (2.9/km²). There were 5,942 housing units at an average density of 3.6 per square mile (1.4/km²). The racial makeup of the county was 81.0% White, 0.5% Black or African American, 0.9% Native American, 0.3% Asian, 0.0% Pacific Islander, 14.7% from other races, and 2.6% from two or more races. 35.2% of the population were Hispanic or Latino of any race.
There were 4,935 households of which 49.5% were married couples living together, 12.6% had a female householder with no husband present, and 32.1% were non-families. 28.3% of all households were made up of individuals and 11.5% had someone living alone who was 65 years of age or older. The average household size was 2.48 and the average family size was 3.04.
In the county, the population was spread out with 27.1% under the age of 18, 9.3% from 18 to 24, 22.7% from 25 to 44, 26.3% from 45 to 64, and 14.6% who were 65 years of age or older. The median age was 36.7 years. For every 100 females there were 97.7 males. For every 100 females age 18 and over, there were 93.1 males.
The median income for a household in the county was $33,969, and the median income for a family was $47,052. Males working full-time and year-round had a median income of $32,359 versus $28,727 for females. The per capita income for the county was $18,429. About 18.7% of families and 22.1% of the population were below the poverty line, including 30.8% of those under age 18 and 13.1% of those age 65 or over.
Politics
Like all of the High Plains, Prowers County is powerfully Republican. It has not been carried by a Democratic Presidential nominee since Jimmy Carter did so in 1976, and Michael Dukakis in 1988 remains the last Democrat to pass forty percent. Hillary Clinton’s 23.6 percent in 2016 is nonetheless the worst by a Democrat for well over a century.
| Year | Republican | Democratic | Others |
|---|---|---|---|
| 2016 | 70.4% 3,531 | 23.6% 1,186 | 6.0% 299 |
| 2012 | 66.4% 3,230 | 31.2% 1,519 | 2.3% 114 |
| 2008 | 65.9% 3,043 | 32.2% 1,487 | 1.8% 85 |
| 2004 | 71.5% 3,392 | 27.6% 1,308 | 1.0% 45 |
| 2000 | 66.9% 3,026 | 30.1% 1,361 | 3.0% 137 |
| 1996 | 53.8% 2,504 | 37.5% 1,745 | 8.7% 403 |
| 1992 | 44.1% 2,371 | 32.9% 1,770 | 23.0% 1,236 |
| 1988 | 56.3% 2,978 | 41.8% 2,207 | 1.9% 101 |
| 1984 | 68.7% 3,501 | 28.8% 1,467 | 2.5% 127 |
| 1980 | 59.8% 3,115 | 32.0% 1,669 | 8.2% 428 |
| 1976 | 46.1% 2,578 | 51.2% 2,861 | 2.7% 149 |
| 1972 | 61.6% 3,272 | 35.0% 1,860 | 3.4% 181 |
| 1968 | 49.1% 2,741 | 41.7% 2,329 | 9.2% 516 |
| 1964 | 35.1% 2,044 | 64.6% 3,759 | 0.3% 19 |
| 1960 | 59.2% 3,567 | 40.8% 2,457 | 0.1% 6 |
| 1956 | 57.6% 3,350 | 42.3% 2,460 | 0.1% 5 |
| 1952 | 65.1% 3,978 | 34.2% 2,087 | 0.7% 43 |
| 1948 | 49.6% 2,505 | 49.5% 2,497 | 0.9% 45 |
| 1944 | 58.7% 2,796 | 40.9% 1,948 | 0.4% 18 |
| 1940 | 56.9% 3,115 | 42.2% 2,309 | 1.0% 53 |
| 1936 | 43.9% 2,432 | 52.3% 2,896 | 3.8% 211 |
| 1932 | 44.9% 2,568 | 52.7% 3,020 | 2.4% 138 |
| 1928 | 71.5% 3,228 | 26.9% 1,216 | 1.6% 71 |
| 1924 | 59.2% 2,564 | 24.1% 1,042 | 16.7% 724 |
| 1920 | 65.0% 2,650 | 30.6% 1,247 | 4.4% 180 |
| 1916 | 40.5% 1,683 | 52.1% 2,168 | 7.4% 307 |
| 1912 | 29.1% 928 | 32.6% 1,042 | 38.3% 1,224[lower-alpha 1] |
Communities
Historic sites
Gallery
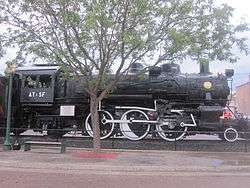 Former Atchison, Topeka, and Santa Fe railroad locomotive on display in Lamar
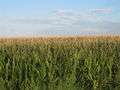 Cornfields flourish after a heavy rain in Prowers County, August 1, 2010
See also
References
- 1 2 "State & County QuickFacts". United States Census Bureau. Retrieved February 11, 2014.
- ↑ "Find a County". National Association of Counties. Retrieved 2011-06-07.
- ↑ "US Gazetteer files: 2010, 2000, and 1990". United States Census Bureau. 2011-02-12. Retrieved 2011-04-23.
- ↑ "Antipodes Map (AKA Tunnel Map)". www.findlatitudeandlongitude.com.
- ↑ "United States Antipodes". www.weathergraphics.com.
- ↑ "Population and Housing Unit Estimates". Retrieved June 9, 2017.
- ↑ "U.S. Decennial Census". United States Census Bureau. Retrieved June 10, 2014.
- ↑ "Historical Census Browser". University of Virginia Library. Retrieved June 10, 2014.
- ↑ "Population of Counties by Decennial Census: 1900 to 1990". United States Census Bureau. Retrieved June 10, 2014.
- ↑ "Census 2000 PHC-T-4. Ranking Tables for Counties: 1990 and 2000" (PDF). United States Census Bureau. Retrieved June 10, 2014.
- ↑ "American FactFinder". United States Census Bureau. Retrieved 2018-02-28.
- ↑ Leip, David. "Dave Leip's Atlas of U.S. Presidential Elections". uselectionatlas.org. Retrieved May 26, 2017.
Notes
- ↑ There was only 1,003 votes for leading “other” candidate, Progressive Theodore Roosevelt, plus 152 for Socialist Eugene Debs and 68 for the Prohibition Party’s Eugene Chafin.
External links
- Prowers County Government website
- Colorado County Evolution by Don Stanwyck
- Colorado Historical Society
Places adjacent to Prowers County, Colorado | ||||||||||
|---|---|---|---|---|---|---|---|---|---|---|
| ||||||||||
Municipalities and communities of Prowers County, Colorado, United States | ||
|---|---|---|
| City | | |
| Towns | ||
| Unincorporated communities | ||