Montrose County, Colorado
| Montrose County, Colorado | |
|---|---|
.jpg) The Montrose County Courthouse in Montrose. | |
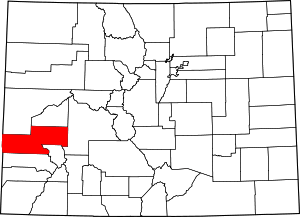 Location in the U.S. state of Colorado | |
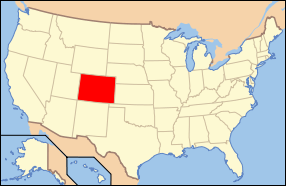 Colorado's location in the U.S. | |
| Founded | February 11, 1883 |
| Named for | City of Montrose |
| Seat | Montrose |
| Largest city | Montrose |
| Area | |
| • Total | 2,243 sq mi (5,809 km2) |
| • Land | 2,241 sq mi (5,804 km2) |
| • Water | 1.9 sq mi (5 km2), 0.08% |
| Population (est.) | |
| • (2015) | 40,946 |
| • Density | 18/sq mi (7/km2) |
| Congressional district | 3rd |
| Time zone | Mountain: UTC−7/−6 |
| Website |
www |
Montrose County is one of the 64 counties of the U.S. state of Colorado. As of the 2010 census, the population was 41,276.[1] The county seat is Montrose,[2] for which the county is named.
Montrose County comprises the Montrose, CO Micropolitan Statistical Area.[3][4]
Geography
According to the U.S. Census Bureau, the county has a total area of 2,243 square miles (5,810 km2), of which 2,241 square miles (5,800 km2) is land and 1.9 square miles (4.9 km2) (0.08%) is water.[5]
Adjacent counties
- Mesa County - north
- Delta County - northeast
- Gunnison County - east
- Ouray County - southeast
- San Miguel County - south
- San Juan County, Utah - west
National protected areas
- Black Canyon of the Gunnison National Park
- Black Canyon of the Gunnison Wilderness
- Curecanti National Recreation Area (part)
- Dominguez-Escalante National Conservation Area (part)
- Gunnison Gorge National Conservation Area (part)
- Gunnison Gorge Wilderness
- Gunnison National Forest (part)
- Manti-La Sal National Forest (part)
- Old Spanish National Historic Trail
- Uncompahgre National Forest (part)
River
- Dolores River (part)
- Uncompahgre River (part)
- San Miguel River(part)
Gunnison River (part)
Trails and byways
- Great Parks Bicycle Route
- Unaweep/Tabeguache Scenic and Historic Byway
- West Elk Loop Scenic Byway
- Western Express Bicycle Route
Historical site
- Hanging Flume
- Historic Town of Uravan
Demographics
| Historical population | |||
|---|---|---|---|
| Census | Pop. | %± | |
| 1890 | 3,980 | — | |
| 1900 | 4,535 | 13.9% | |
| 1910 | 10,291 | 126.9% | |
| 1920 | 11,852 | 15.2% | |
| 1930 | 11,742 | −0.9% | |
| 1940 | 15,418 | 31.3% | |
| 1950 | 15,220 | −1.3% | |
| 1960 | 18,286 | 20.1% | |
| 1970 | 18,366 | 0.4% | |
| 1980 | 24,352 | 32.6% | |
| 1990 | 24,423 | 0.3% | |
| 2000 | 33,432 | 36.9% | |
| 2010 | 41,276 | 23.5% | |
| Est. 2016 | 41,471 | [6] | 0.5% |
| U.S. Decennial Census[7] 1790-1960[8] 1900-1990[9] 1990-2000[10] 2010-2015[1] | |||
As of the census[11] of 2010, there were 41,276 people, 16,484 households, and 11,461 families residing in the county. The population density was 18 people per square mile (7/km²). There were 18,250 housing units at an average density of 8 per square mile (3/km²). The racial makeup of the county was 86.70% White, 0.40% Black or African American, 1.10% Native American, 0.60% Asian, 0.10% Pacific Islander, 8.70% from other races, and 2.40% from two or more races. 19.70% of the population were Hispanic or Latino of any race.
There were 16,484 households out of which 31.20% had children under the age of 18 living with them, 56.10% were married couples living together, 9.10% had a female householder with no husband present, and 30.50% were non-families. 25.80% of all households were made up of individuals and 12.00% had someone living alone who was 65 years of age or older. The average household size was 2.47 and the average family size was 2.97.
The county population was spread out with 24.70% under the age of 18, 6.40% from 18 to 24, 22.50% from 25 to 44, 28.60% from 45 to 64, and 17.80% who were 65 years of age or older. The median age was 42 years. For every 100 females there were 96.00 males. For every 100 females age 18 and over, there were 94.00 males.
Also from the census[12] of 2010, the median income for a household in the county was $46,058, and the median income for a family was $52,152. Males had a median income of $41,301 versus $31,659 for females. The per capita income for the county was $22,413. About 7.30% of families and 10.20% of the population were below the poverty line, including 13.40% of those under age 18 and 9.80% of those age 65 or over.
Politics
Montrose is a powerfully Republican county. It has not been won by a Democratic Presidential nominee since Lyndon Johnson‘s 1964 landslide – indeed since then, no Democrat has managed forty percent of the county’s vote. The county has leaned Republican ever since 1920; although before this, it did tend to vote Democratic between 1896 and 1916 except during the landslide loss of Alton B. Parker in 1904.
| Year | Republican | Democratic | Others |
|---|---|---|---|
| 2016 | 67.9% 14,382 | 25.8% 5,466 | 6.3% 1,338 |
| 2012 | 67.3% 13,552 | 30.5% 6,138 | 2.2% 440 |
| 2008 | 63.7% 12,199 | 33.9% 6,495 | 2.4% 459 |
| 2004 | 69.2% 11,218 | 29.5% 4,776 | 1.4% 225 |
| 2000 | 65.2% 9,266 | 28.4% 4,041 | 6.4% 908 |
| 1996 | 55.0% 6,730 | 32.8% 4,019 | 12.2% 1,490 |
| 1992 | 41.4% 4,847 | 31.7% 3,713 | 27.0% 3,163 |
| 1988 | 60.2% 6,012 | 37.5% 3,748 | 2.3% 233 |
| 1984 | 70.4% 7,162 | 28.2% 2,864 | 1.5% 147 |
| 1980 | 68.2% 6,685 | 22.8% 2,232 | 9.0% 883 |
| 1976 | 58.4% 4,838 | 38.2% 3,164 | 3.4% 280 |
| 1972 | 64.8% 4,571 | 26.5% 1,870 | 8.8% 618 |
| 1968 | 52.9% 3,547 | 35.7% 2,394 | 11.5% 771 |
| 1964 | 39.9% 2,678 | 59.8% 4,009 | 0.3% 22 |
| 1960 | 58.3% 4,040 | 41.3% 2,861 | 0.4% 24 |
| 1956 | 62.0% 4,054 | 37.7% 2,461 | 0.3% 19 |
| 1952 | 67.2% 4,279 | 32.0% 2,037 | 0.9% 55 |
| 1948 | 48.3% 2,473 | 49.7% 2,544 | 1.9% 99 |
| 1944 | 56.4% 2,952 | 43.1% 2,258 | 0.5% 27 |
| 1940 | 54.6% 3,744 | 44.0% 3,013 | 1.4% 98 |
| 1936 | 41.4% 2,248 | 54.2% 2,938 | 4.4% 239 |
| 1932 | 41.0% 1,992 | 51.8% 2,516 | 7.2% 350 |
| 1928 | 67.3% 2,873 | 30.4% 1,297 | 2.4% 101 |
| 1924 | 45.8% 2,077 | 27.3% 1,239 | 26.8% 1,217 |
| 1920 | 54.8% 2,225 | 37.5% 1,522 | 7.7% 311 |
| 1916 | 31.5% 1,315 | 61.5% 2,571 | 7.0% 293 |
| 1912 | 16.8% 631 | 39.4% 1,478 | 43.8% 1,643[lower-alpha 1] |
In other offices, Montrose also is strongly Republican. The last Democratic Senatorial candidate it backed was Ben “Nighthorse” Campbell, who was later to shift to the Republican Party, in the 1992 election,[14] and since then no Democratic Senatorial candidate has passed forty percent either. Montrose County did back Constitution Party nominee Tom Tancredo in the 2010 gubernatorial election,[15] and Bill Ritter did win 46 percent in 2006,[16] but Roy Romer in 1990 remains the last Democratic candidate for governor to win Montrose County.[17]
Culture
- Ute Indian State History Museum
Communities
City
Towns
Census-designated place
Other unincorporated places
See also
Notes
- ↑ The leading “Other candidate”, Progressive Theodore Roosevelt, received 1,022 votes, Socialist Eugene V. Debs received 431 votes, Prohibition Party nominee Eugene Chafin 187 votes, and Socialist Labor Party nominee Arthur Reimer 3 votes.
References
- 1 2 "State & County QuickFacts". United States Census Bureau. Archived from the original on July 15, 2011. Retrieved June 8, 2014.
- ↑ "Find a County". National Association of Counties. Retrieved 2011-06-07.
- ↑ "OMB Bulletin No. 10-02: Update of Statistical Area Definitions and Guidance on Their Uses" (PDF). United States Office of Management and Budget. December 1, 2009. Archived from the original (PDF) on March 16, 2012. Retrieved April 19, 2012.
- ↑ See the Colorado census statistical areas.
- ↑ "US Gazetteer files: 2010, 2000, and 1990". United States Census Bureau. 2011-02-12. Retrieved 2011-04-23.
- ↑ "Population and Housing Unit Estimates". Retrieved June 9, 2017.
- ↑ "U.S. Decennial Census". United States Census Bureau. Retrieved June 8, 2014.
- ↑ "Historical Census Browser". University of Virginia Library. Retrieved June 8, 2014.
- ↑ "Population of Counties by Decennial Census: 1900 to 1990". United States Census Bureau. Retrieved June 8, 2014.
- ↑ "Census 2000 PHC-T-4. Ranking Tables for Counties: 1990 and 2000" (PDF). United States Census Bureau. Retrieved June 8, 2014.
- ↑ "American FactFinder; 2010 Census Demographic Profile Summary File". United States Census Bureau. Retrieved 2011-05-31.
- ↑ "American FactFinder; 2008-2010 American Community Survey 3-Year Estimates". United States Census Bureau. Retrieved 2011-11-22.
- ↑ Leip, David. "Dave Leip's Atlas of U.S. Presidential Elections". uselectionatlas.org. Retrieved May 26, 2017.
- ↑ Dave Leip’s U.S. Election Atlas; 1992 Senatorial General Election Results – Colorado
- ↑ Dave Leip’s U.S. Election Atlas; 2010 Gubernatorial General Election Results
- ↑ Dave Leip’s U.S. Election Atlas; 2006 Gubernatorial General Election Results
- ↑ Dave Leip’s U.S. Election Atlas; 1990 Gubernatorial General Election Results
External links
- Montrose County Government website
- Colorado County Evolution by Don Stanwyck
- Colorado Historical Society
Places adjacent to Montrose County, Colorado | ||||||||||
|---|---|---|---|---|---|---|---|---|---|---|
| ||||||||||
Municipalities and communities of Montrose County, Colorado, United States | ||
|---|---|---|
| City | | |
| Towns | ||
| CDP | ||
| Unincorporated communities | ||
| Ghost town | ||